Integrating JavaScript map chart with APEX
This document talks about how to Integrate APEX with JavaScript map chart.
Technologies and Tools used:
The following technologies has been used to Integrating JavaScript map chart with APEX.
- Oracle Apex
- JavaScript
Use Case:
Assume that there is a requirement to display map from available data.
Architecture:
Following steps explains in detail,
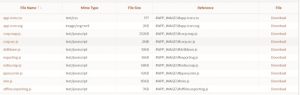
- Create an Oracle Apex Application and go to Shared Components => Files => Static Files, then upload necessary JavaScript files as shown below,
- Create a Region and set type as “Static Content”

- <div id = “container”
style = “height: 500px; min-width: 310px; max-width: 800px; margin: 0 auto” > < /div> <script >
var data = Corp.geojson(Corp.maps[‘countries/in/in-all’]), //To call parent map data.js file example India
Map india.map_
separators = Corp.geojson(Corp.maps[‘countries/in/in-all’], ‘mapline’),
// Some responsiveness
small = $(‘#container’).width() < 400;
// Set drilldown pointers
$.each(data, function(i) {
this.drilldown = this.properties[‘hc-a2’];
this.value = i; // Non-random bogus data
});
// Instantiate the map
Corp.mapChart(‘container’, {
chart: {
events: {
drilldown: function(e) {
if (!e.seriesOptions) {
var chart = this,
mapKey = ‘countries/in/in-‘ + e.point.drilldown,
// Handle error, the timeout is cleared on success
fail = setTimeout(function() {
if (!Corp.maps[mapKey]) {
chart.showLoading(‘<i class=”icon-frown”></i> Failed loading ‘ + e.point.name);
fail = setTimeout(function() {
chart.hideLoading();
}, 1000);
}
}, 3000);
// Show the spinner
chart.showLoading(‘<i class=”icon-spinner icon-spin icon-3x”></i>’); // Font Awesome spinner
//alert(e.point.drilldown);
// Load the drilldown map
//$.getScript(‘https://code.highcharts.com/mapdata/’ + mapKey + ‘.js’, function () {
$.getScript(‘#APP_IMAGES#’ + e.point.drilldown + ‘.map.js’, function() {
// To call child map data for example Tamilnadu map will be displayed by clicking India
. tn.map_
data = Corp.geojson(Corp.maps[mapKey]);
// Set a non-random bogus value
$.each(data, function(i) {
this.value = i;
});
// Hide loading and add series
chart.hideLoading();
clearTimeout(fail);
chart.addSeriesAsDrilldown(e.point, {
name: e.point.name,
data: data,
dataLabels: {
enabled: true,
format: ‘{point.StateCode}’
}
});
});
}
this.setTitle(null, {
text: e.point.name
});
},
drillup: function() {
this.setTitle(null, {
text: ”
});
}
}
},
title: {
text: ‘India Map’
},
subtitle: {
text: ”,
floating: true,
align: ‘right’,
y: 50,
style: {
fontSize: ’16px’
}
},
legend: small ? {} : {
layout: ‘vertical’,
align: ‘right’,
verticalAlign: ‘middle’
},
colorAxis: {
min: 0,
minColor: ‘#E6E7E8’,
maxColor: ‘#005645’
},
mapNavigation: {
enabled: true,
buttonOptions: {
verticalAlign: ‘bottom’
}
},
plotOptions: {
map: {
states: {
hover: {
color: ‘#EEDD66’
}
}
}
},
series: [{
data: data,
name: ‘India’,
dataLabels: {
enabled: true,
format: ‘{point.properties.postal-code}’
}
}, {
type: ‘mapline’,
data: separators,
color: ‘silver’,
enableMouseTracking: false,
animation: {
duration: 500
}
}],
drilldown: {
activeDataLabelStyle: {
color: ‘#FFFFFF’,
textDecoration: ‘none’,
textOutline: ‘1px #000000’
},
drillUpButton: {
relativeTo: ‘spacingBox’,
position: {
x: 0,
y: 60
}
}
}
});
</script>
Sample exported support files:
<script src = “#APP_IMAGES#min.js” > < /script>
< script src = “#APP_IMAGES#corp.map.js” > < /script>
< script src = “#APP_IMAGES#drilldown.js” > < /script>
< script src = “#APP_IMAGES#exporting.js” > < /script>
< script src = “#APP_IMAGES#offline.exporting.js” > < /script>
<script src = “#APP_IMAGES#india.map.js” > < /script>
<script src = “#APP_IMAGES#corp.src.js” > < /script>
Note : If there is any requirement to display the world map or district level for any state, Download the geometric polygon/Multi-polygon co-ordinates and follow the steps given above.
Output:
Now India map has been displayed.

