1.Overview
This Flexible Region Plugin can be used for various business requirements to see the data in multiple dimensions.
The user can able to dynamically choose the objects like tables or views and their columns to get the data in different output formats.
This plugin helps both the user & developer to save the time effort by the way of reducing the page,region creation and source code changes in apex.
This plugin is an one time setup and it can be deployed or reused to any apex application.
The following output formats are
- Pie chart
- Pie 3d chart
- Donut chart
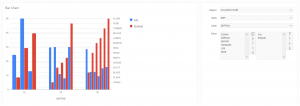
- column chart
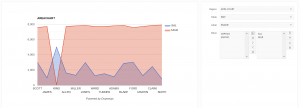
- Area chart
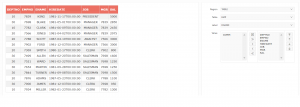
- HTML Table Report
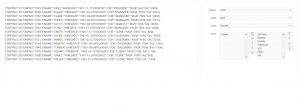
- JSON Format
2.Prerequisite
- Basic knowledge of HTML, CSS and JavaScript.
- Basic understanding of ORACLE APEX & Dynamic SQL features.
- To get started you should at least know the following features:
3.Technologies and Tools Used
The following technologies has been used to achieve the Flexible Report Plugin functionality.
- HTML
- CSS
- JAVASCRIPT
- SQL/PLSQL
- ORACLE APEX
4.Use Case
The user can able to choose the Region type, Object, label and their column values to get the result.
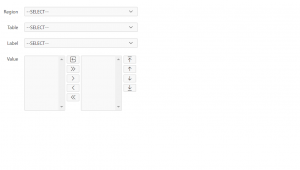
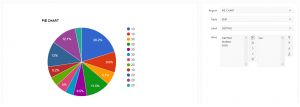
Procedures:
Step1: The user has download the plugin & import in to oracle apex application via shared components.
Step2: Create a region and set type as Doyensys – Chart Plugin.
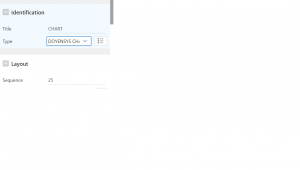
Step3: Create page items to get the inputs from the user
a.PX_Chart_Type
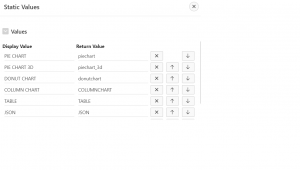
b.PX_Object_Name
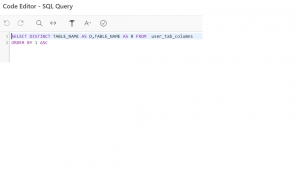
c.PX_Label_Name
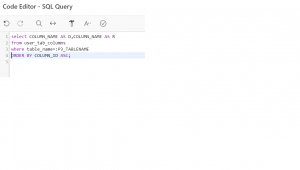
d.PX_Values
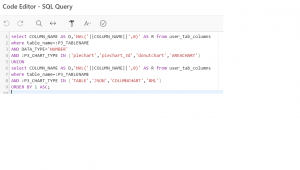
Step4: Copy & Paste the code in in page Processing section.
DECLARE
l_query VARCHAR2(2000);
lv_values VARCHAR2(2000);
cond_var VARCHAR2(200) := ‘ 1 = 1 ‘;
BEGIN
BEGIN
BEGIN
IF
:p3_chart_type IN (
‘piechart’,
‘piechart_3d’,
‘donutchart’
)
THEN
l_query := ‘SELECT distinct ”’
||:p3_chart_type
|| ”’AS CHART_TYPE,”’
||:p3_label
|| ”’AS LABEL,’
|| replace(:p3_label,’:’,’,’)
|| ‘,’
||:p3_value
|| ‘ AS VALUE from ‘
||:p3_tablename;
ELSIF :p3_chart_type IN (
‘COLUMNCHART’,
‘AREACHART’
) THEN
l_query := ‘SELECT distinct ”’
||:p3_chart_type
|| ”’AS CHART_TYPE,”’
||:p3_label
|| ‘,’
|| replace(replace(replace(:p3_value,’NVL(‘,”),’,0)’,”),’:’,’,’)
|| ”’as label’
|| ‘, replace( (JSON_ARRAY(‘
||:p3_label
|| ‘,’
|| replace(:p3_value,’:’,’,’)
|| ‘) ),”””,””””) from ‘
||:p3_tablename;
–RAISE_APPLICATION_ERROR(-20002,’ERR’||l_query);
ELSIF :p3_chart_type = ‘TABLE’ THEN
lv_values := replace(replace(replace(:p3_value,’NVL(‘),’,0)’),’:’,’,’);
BEGIN
SELECT
‘SELECT ”’
||:p3_chart_type
|| ”’AS CHART_TYPE,”’
||:p3_label
|| ”’ AS LABEL,JSON_OBJECT(‘
||
LISTAGG( (””
|| column_value
|| ””
|| ‘ IS ‘
|| column_value),’,’) WITHIN GROUP(
ORDER BY
1 ASC
)
|| ‘) FROM ‘
||:p3_tablename data_set
INTO l_query
FROM
TABLE ( vc_in_list(lv_values) );
EXCEPTION
WHEN OTHERS THEN
raise_application_error(-20002,’ERR’ || l_query);
END;
ELSIF :p3_chart_type = ‘JSON’ THEN
lv_values := replace(replace(replace(:p3_value,’NVL(‘),’,0)’),’:’,’,’);
BEGIN
SELECT
‘SELECT ”’
||:p3_chart_type
|| ”’AS CHART_TYPE,”’
||:p3_label
|| ”’ AS LABEL,JSON_OBJECT(‘
||
LISTAGG( (””
|| column_value
|| ””
|| ‘ IS ‘
|| column_value),’,’) WITHIN GROUP(
ORDER BY
1 ASC
)
|| ‘) FROM ‘
||:p3_tablename data_set
INTO l_query
FROM
TABLE ( vc_in_list(lv_values) );
EXCEPTION
WHEN OTHERS THEN
raise_application_error(-20002,’ERR’ || l_query);
END;
ELSIF :p3_chart_type = ‘XML’ THEN
lv_values := replace(replace(replace(:p3_value,’NVL(‘),’,0)’),’:’,’,’);
l_query := ‘SELECT ”’
||:p3_chart_type
|| ”’,”’
||:p3_tablename
|| ”’,”’
|| lv_values
|| ”’ FROM DUAL’;
–RAISE_APPLICATION_ERROR(-20002,’ERR’||l_query);
END IF;
IF
apex_collection.collection_exists(p_collection_name => ‘DOY_PIE_CHART’)
THEN
apex_collection.delete_collection(p_collection_name => ‘DOY_PIE_CHART’);
apex_collection.create_collection_from_query(p_collection_name => ‘DOY_PIE_CHART’,p_query => l_query
|| ‘ where ‘
|| cond_var,p_generate_md5 => ‘YES’);
ELSE
apex_collection.create_collection_from_query(p_collection_name => ‘DOY_PIE_CHART’,p_query => l_query
|| ‘ where ‘
|| cond_var,p_generate_md5 => ‘YES’);
END IF;
COMMIT;
END;
EXCEPTION
WHEN OTHERS THEN
raise_application_error(-20002,’Please Provide the Proper Values.’);
END;
END;
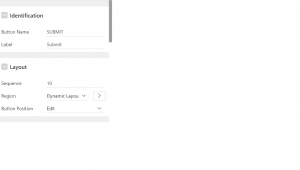
Step5: Create a Submit button to get the Result.
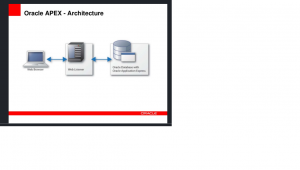
5.Architecture
6.Key Features
Available Features
- Pie chart
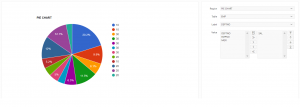
- Pie 3d chart
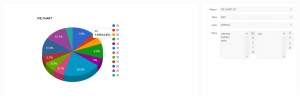
- Donut chart
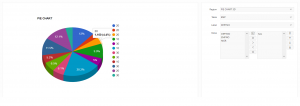
- column chart
- Area chart
- HTML Table Report
- JSON Format
7.URL / Links
https://apex.oracle.com/pls/apex/f?p=103274:LOGIN_DESKTOP:709829854586945:::::
User Name : Demo
Password : Demo@12345

