How to Monitor the Performance of MYSQL Database
Introduction: –
Monitoring MySQL performance is crucial for maintaining a healthy and efficient database system. There are several tools and techniques you can use to monitor MySQL performance. Here are some common methods:
MySQL Performance Schema: –
MySQL includes a Performance Schema that provides a comprehensive set of tables for monitoring server performance. You can query these tables to obtain information on events, stages, statements, and more.
Example query:
SELECT * FROM performance_schema.events_statements_summary_by_digest;

MySQL Query Execution Plan:
Analyzing the execution plan of SQL queries can help identify inefficient queries and missing indexes.
Use the EXPLAIN statement to obtain the query execution plan:
EXPLAIN SELECT * FROM your_table WHERE your_condition;

MySQL Slow Query Log:
Enable the slow query log to capture queries that take longer than a specified threshold. Analyze the log to identify and optimize slow queries.
To enable the slow query log, add the following lines to your MySQL configuration file:slow_query_log = 1
slow_query_log_file = /path/to/slow-query.log
long_query_time = 2 # Time in seconds (adjust as needed)

MySQL Performance Tuning Tools:
There are various third-party tools designed specifically for MySQL performance tuning. Examples include MySQLTuner and Percona Toolkit. These tools analyze your MySQL instance and provide recommendations for optimization.
MySQL Workbench:
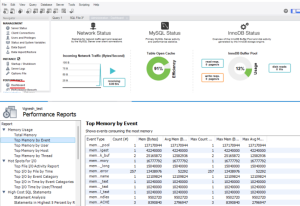
MySQL Workbench includes a performance dashboard that provides real-time monitoring of key performance metrics. It allows you to visualize server status, query execution times, and other important indicators.
Open MySQL Workbench, connect to your server, and navigate to the Performance dashboard.
Operating System Tools:

MySQL Enterprise Monitor;
MySQL Enterprise Edition includes MySQL Enterprise Monitor, a web-based tool for monitoring and managing MySQL servers. It provides alerts, performance graphs, and recommendations for optimization.
InnoDB Metrics:
For InnoDB storage engine, monitor InnoDB metrics such as buffer pool usage, I/O performance, and page flushing.
Example query to check InnoDB buffer pool usage:
SHOW ENGINE INNODB STATUS;
Conclusion: –
In conclusion, monitoring MySQL performance involves using tools like the Performance Schema, slow query logs, and MySQL Workbench to track and optimize database operations. Regularly analyzing these metrics helps maintain efficiency and address performance issues.

