Introduction
In this blog post, we’ll explore the best practices for building effective and efficient data models in Power BI. Data modeling involves creating visual representations of data structures and their attributes. The widely adopted star schema is the recommended approach in Power BI for designing data models.
Key benefits of using a star schema:
- Usability: It organizes your data model, making reports cleaner and easier to use.
- Performance: Enables scalability for large datasets, faster DAX calculations, and quicker report refreshes.
Why is Data Modeling in Power BI so Important?
Data modeling is the foundation of a Power BI report. If there is no solid model, the visualizations produced may not actually represent the data, which could lead to confusion and incorrect insights.
Advantages of Effective Data Modeling
Performance: This reduces the loading time for reports by optimizing queries.
Ease of Use: Simplifies report creation by providing a clear and logical structure.
Scalability: Supports future requirements with minimal changes.
Accurate Insights: Ensures data integrity and correctness in calculations.
Star Schema in Power BI:
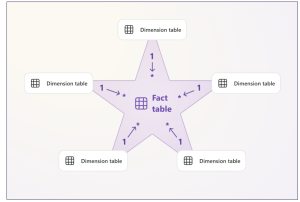
A star schema is a simple, efficient design for organizing data in a way that enhances usability and performance in Power BI. It gets its name from the star-like shape formed when connecting a central fact table to multiple surrounding dimension tables. This design is widely recommended for data modeling in Power BI and other data warehousing systems.
Components of a Star Schema:
- Fact Table:
- Contains numerical data or metrics, such as sales, revenue, or quantities.
- Includes foreign keys to connect to related dimension tables.
- Typically holds large amounts of data and is optimized for calculations.
- Dimension Tables:
- Contain descriptive attributes, such as product names, dates, or geographic locations.
- Provide context for the metrics in the fact table.
- Are denormalized for simplicity and better performance.
Benefits of Using a Star Schema:
- Improved Usability:
- Simplifies report creation by organizing data in a user-friendly structure.
- Easier to understand and navigate for end-users.
- Enhanced Performance:
- Streamlines data processing by reducing joins and relationships.
- Speeds up DAX calculations and data refreshes.
- Scalability:
- Efficiently handles large datasets without performance degradation.
Why Star Schema in Power BI?
Power BI is optimized for star schemas, as they minimize complex relationships and reduce ambiguities in calculations. This design ensures efficient aggregation of data and supports intuitive report building for both technical and non-technical users.
Source:Microsoft.com
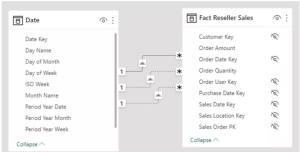
Role-Playing Dimensions in Power BI Data Modeling:
In Power BI data modeling, a role-playing dimension is a single dimension table that can be used multiple times in different contexts within the same data model. This is useful when the same dimension, such as a Date table, relates to multiple columns in a fact table for different purposes (e.g., order date, shipment date, and due date).
Key Characteristics of Role-Playing Dimensions:
Reusability: One dimension table can be reused in multiple roles.
Simplified Maintenance: Updates to the dimension table automatically reflect across all roles.
Reduced Redundancy: Avoids duplicating the same dimension table for different roles, minimizing storage overhead.
How to organize the fact, dimension and measure:
Use Clear Naming Conventions:
Adopt organization-specific naming conventions for tables, columns, and measures.
Use business-friendly names that are easy to understand (e.g., “Order Date” instead of “ORD_DT”).
Hide Unnecessary Columns:
Hide technical fields like surrogate keys or columns used for relationships but irrelevant to end users.
This keeps the model clean and focused on meaningful data.
Follow the Star Schema Structure:
Organize your tables into fact tables (transactional data) and dimension tables (contextual information).
Ensure a clear one-to-many relationship between fact and dimension tables.
Create Explicit Measures:
Define all calculations using explicit DAX measures, even for simple sums or averages.
Group related measures into dedicated folders or measure tables for better organization and usability.
Enhance Usability with Hierarchies and Formatting:
Build hierarchies (e.g., Year → Quarter → Month) to simplify data exploration.
Format numeric fields and measures appropriately to improve readability.
Conclusion:
Effective data modeling in Power BI is essential for creating impactful and user-friendly reports. By following these best practices, you can ensure better performance, scalability, and user satisfaction. Start implementing these techniques in your Power BI projects and experience the difference!