ADDING & GROUPING SERVER IN LOGIC MONITOR
INTRODUCTION:
Logic Monitor is a cloud-based infrastructure monitoring solution designed to help organizations monitor the health and performance of their IT systems. It provides real-time monitoring, alerts, and reporting on the availability and performance of servers, networks, applications, and cloud services.
Logic Monitor collects data from various sources, such as agents installed on servers, SNMP, WMI, and APIs, and visualizes this data on a single dashboard.
Adding a server to Logic Monitor can be accomplished in a few steps. Here is how you can add a server to Logic Monitor.
STEP 1: Configure Simple Network Management Protocol(SNMP) on the server end.
1.1 –> Install SNMPD service
yum install net-snmp*
1.2 –> Configure the “snmpd.conf” file.
- Take a backup of snmpd.conf
File Path: /etc/snmp/snmpd.conf
#cp -rf /etc/snmp/snmpd.conf /etc/snmp/snmpd.conf.bkp
1.3–> Configure the community string and access control in snmpd.conf file
- Add the following line to the file to set the community string,
rocommunity public
- Add the following lines to limit access to the SNMP service to a specific IP address or network,
rocommunity public 10.0.0.0/24
1.4 –> Start the snmpd service.
#systemctl enable snmpd
#systemctl start snmpd
1.5 –> Allowing SNMP ports in the firewall.
NOTE: If Firewall is not running or disabled no need to execute the below steps.
Execute the below commands to add UDP ports in Firewall
#firewall-cmd –zone=public –add-port=161/udp –permanent
#firewall-cmd –zone=public –add-port=162/udp –permanent
#firewall-cmd –reload
STEP 2: Adding Server to Logic Monitor
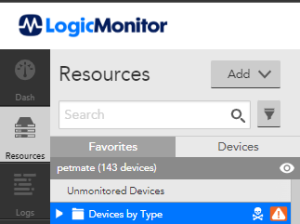
2.1 –> Go to Resource

2.2 –> Click Add
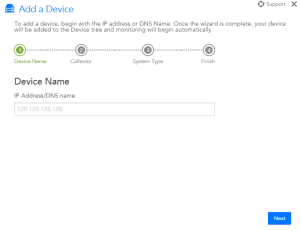
- Click Add–> One Device –> Wizard

- Enter the IP Address or DNS name of the server you want to add.

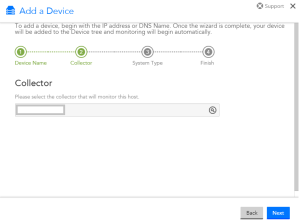
- Choose the appropriate collector in the drop-down menu.

- Click the “Add Device” button.
Your server will be added successfully. Once the device is added, Logic Monitor will start monitoring it and display real-time data on its performance. You can also set up alerts, configure custom metrics, and view detailed reports on the server’s performance.
STEP 3: Grouping Servers
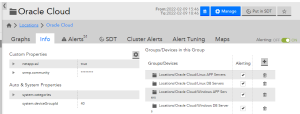
Grouping servers refers to the process of organizing servers into specific groups based on certain criteria, such as location, function, or environment. By grouping servers, you can easily manage, monitor, and view the performance data of multiple servers as a single entity.
- Navigate to the “Settings” section.
- Click on the “Devices” tab.
- Click on the “Device Groups” button.
- Click on the “Add Group” button.
- Give the group a name and select a parent group (if applicable).
- Choose the devices you want to add to the group.
- Click on the “Save” button.

CONCLUSION:
The platform supports various devices and operating systems, including Windows, Linux, Unix, and cloud-based services such as OCI, AWS, Azure, and Google Cloud. You can accomplish various monitoring scenarios in your IT infrastructure, and you can create several alert functions for various group entities or single entities according to your need in the environment.
