Introduction: –
This document is about how to customize JET charts using APEX_API in Oracle APEX. Oracle JET (JavaScript Extension Toolkit) is an open-source JavaScript framework designed to build modern, interactive web applications. Among its many features, Oracle JET provides a set of robust data visualization components, including charts. These chart components are highly customization and support various types of visualizations, making them suitable for dashboards, reports, and analytic applications.
The following technologies have been used how to customize JET charts using APEX_API in Oracle APEX.
- Javascript
- Oracle APEX
Why we need to do: –
If the requirement arises to customize charts for showing the consolidated data or overview of the application as dashboard we can use this approach to show as dynamic dashboard.
How do we solve:
The following steps will help to customize JET charts in Oracle APEX
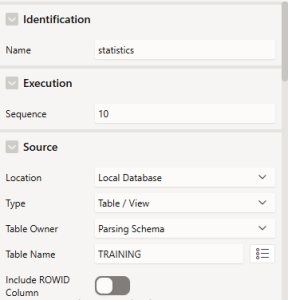
Step 1: Create a chart region and source as Table(Training).
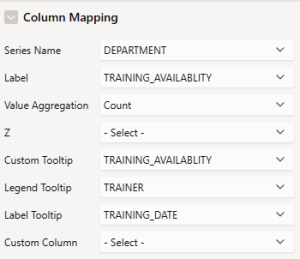
Step2: Choose the series name column, label, custom tooltip, legend tooltip to display as chart region.
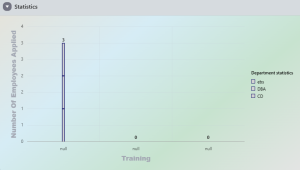
Step 3: Choose the chart type as Bar chart and choose the animation based on the requirement.
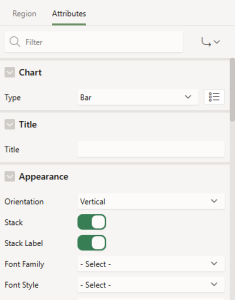
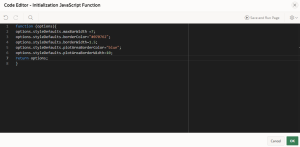
Step 4: To customize the properties of the bar chart, paste the following code in Initialization javascript function section.
options.styleDefaults.maxBarWidth =7;
options.styleDefaults.borderColor=”#070762″;
options.styleDefaults.borderWidth=1.5;
options.styleDefaults.plotAreaBorderColor=”blue”;
options.styleDefaults.plotAreaBorderWidth=10;
return options;
}
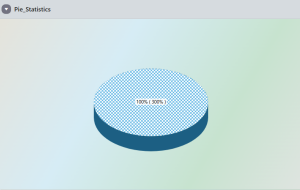
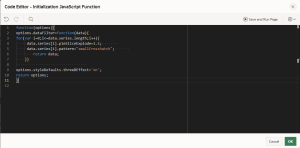
Step 5: To customize the properties of the pie chart, paste the following code in Initialization javascript function section.
Code:
function(options){
options.dataFilter=function(data){
for(var i=0;i<=data.series.length;i++){
data.series[i].pieSliceExplode=1.5;
data.series[i].pattern=”smallCrosshatch”;
return data;
}}
options.styleDefaults.threeDEffect=’on’;
return options;
}
Conclusion:
In summary, the JET chart API provides a flexible way to enhance the functionality of charts in Oracle APEX, allowing for customization’s such as adding markers, series properties, highlighting patterns etc.
