Introduction
When working with dates in Power BI, it’s essential to understand the nuances of how they can be used as both measures and dimensions. In this blog, we’ll delve into the technical aspects of dates in Power BI, exploring the differences between using dates as measures and dimensions, and providing practical tips on how to effectively utilize them in your reports.
Why we need to do
Dates as Measures
In Power BI, a measure is a calculated field that performs a specific calculation on the data. When using dates as measures, you’re essentially creating a calculated field that returns a date value. This can be useful when you need to perform date-based calculations, such as calculating the number of days between two dates or determining the current date.
Real-Life Scenario
Let’s say you’re a marketing manager at a retail company, and you want to analyze the sales of a specific product over the past week. You can create a measure that calculates the number of days since the product was launched, and then use that measure to filter the data to only show sales from the past week.
Let’s break down each of these date measures and provide more examples:
| Scenario | Description | Formula |
| Number of Days Since Launch | Returns the number of days since the product was launched.
Example: If the product was launched on January 1, 2023, and today’s date is March 10, 2023, the measure would return “69”.
|
=DATEDIFF (LaunchDate, TODAY (), DAY) |
| Number of Days Since Last Sale
|
Returns the number of days since the last sale.
Example: If the last sale was on February 20, 2023, and today’s date is March 10, 2023, the measure would return “18”.
|
=DATEDIFF (LastSaleDate, TODAY (), DAY)
|
| Number of Days Until Next Sale | Returns the number of days until the next sale.
Example: If the next sale is scheduled for March 15, 2023, and today’s date is March 10, 2023, the measure would return “5”.
|
=DATEDIFF(TODAY (), NextSaleDate, DAY) |
| Number of Days Since Last Promotion | Returns the number of days since the last promotion.
Example: If the last promotion was on February 10, 2023, and today’s date is March 10, 2023, the measure would return “28”.
|
=DATEDIFF (LastPromotionDate, TODAY (), DAY) |
| Number of Days Until Next Promotion | Returns the number of days until the next promotion.
Example: If the next promotion is scheduled for March 20, 2023, and today’s date is March 10, 2023, the measure would return “10”.
|
=DATEDIFF (TODAY (), NextPromotionDate, DAY) |
These date measures can be used to analyze sales data and make informed decisions about product launches, promotions, and sales strategies. By using these measures, you can gain insights into the performance of your products and make data-driven decisions to drive business growth.
Dates as Dimensions
In Power BI, a dimension is a field that categorizes data into groups or categories. When using dates as dimensions, you’re essentially creating a field that categorizes data based on date values. This can be useful when you need to analyze data by date, such as analyzing sales by day, week, or month.
Real-Life Scenario
Let’s say you’re a sales manager at a retail company, and you want to analyze the sales of your products by day, week, and month. You can create a date dimension that categorizes the sales data by day, week, and month, and then use that dimension to create a report that shows the sales trends over time.
Here are some examples of date dimensions:
| Example | Description | Formula |
| Date Dimension | This table contains a list of dates, with each date represented by a unique value. | =DATEADD (DATE, 0, DAY) |
| Date Table | This table contains a list of dates, with each date represented by a unique value, and additional columns for day, week, month, and year. | =DATEADD (DATE, 0, DAY), =WEEKDAY(DATE), =MONTH(DATE), =YEAR (DATE |
Examples of Using Date Dimensions:
| Scenario | Description | Formula |
| Sales by Day | Create a table that displays sales data by day, using the date dimension to categorize the data by date.
|
=SUM(Sales) BY Date Dimension [Date] |
| Sales by Week | Create a table that displays sales data by week, using the date dimension to categorize the data by week.
|
=SUM(Sales) BY Date Dimension [Week] |
| Sales by Month | Create a table that displays sales data by month, using the date dimension to categorize the data by month.
|
=SUM(Sales) BY Date Dimension [Month] |
| Customer Behavior | Create a table that displays customer behavior by date, using the date dimension to categorize the data by date.
|
= COUNT(Customers) BY Date Dimension [Date] |
Key Differences
When using dates as measures and dimensions, there are some key differences to keep in mind:
| Features | Measure | Dimension |
| Purpose | Provides a value for calculation | Categorizes data |
| Usage | Used In Calculation (e.g., sum of sales, average price) | Used for filtering and analysis (e.g., filtering data for a specific date range, grouping data by year) |
| Example | Total sales for a specific date | Year, quarter, month, day of the week |
How do we solve
Dates as Measures
For example, you can create a date measure in Power BI by following these steps:
1.Go to the Modeling tab and click on “New Measure”. Name the measure “Today’s Date”.
![]()
![]()
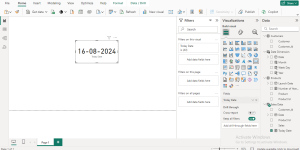
2.In the formula bar, enter the formula =TODAY (). In the formula bar, enter the formula =TODAY (). Click “OK” to create the measure.
![]()
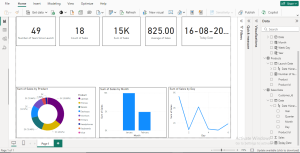
3.Once created, you can use the “Today’s Date” measure in your reports to display the current date.
Dates as Dimensions
For example, you can create a date dimension in Power BI by following these steps:
1.Go to the Modelling tab and click on “New Table”. Name the table “Date Dimension”.
![]()
![]()
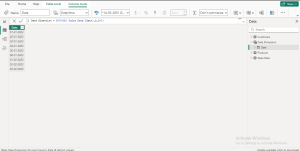
2. Create a new column and name it “Date”.
![]()
3. In the formula bar, enter the formula =DATEADD (DATE, 0, DAY). Click “OK” to create the table.
Best Practices
When working with dates in Power BI, here are some best practices to keep in mind:
| Practices | Description |
| Dedicated Date Table | Create a separate date table with columns for date, year, quarter, month, day, week, etc. |
| Clear Distinctions | Use measures for calculations and dimensions for categorization. |
| Leverage Time Intelligence | Utilize DAX functions like DATEADD, DATESINPERIOD, TOTALQTD for time-based calculations. |
| Format for Display | Employ the FORMAT function to control date display in visuals. |
| Calendar Considerations | Account for different calendar types (Gregorian, Fiscal, etc.) if needed. |
| Performance Optimization | Consider using compressed date formats or calculated columns for performance improvements. |
| Data Consistency | Ensure date data is consistent across different data sources. |
Conclusion
By comprehending the distinction between dates as measures and dimensions, you can effectively leverage Power BI’s capabilities for in-depth time-based analysis. By following best practices, you’ll create accurate, informative, and visually appealing reports that drive informed decision-making.