Diagnosing performance issues in old sessions is easy with an Oracle Database feature called Active Session History. Every second, Active Session History polls the database to identify the active sessions and dumps relevant information about each of them—such as the user ID, state, the machine it is connected from, and the SQL it is executing in the ASH buffer. So even though a session is no longer present in the database instance, the ASH buffer has captured its information. In addition, because Active Session History records activities every second, it can show a second-by-second snapshot of the activities in a session.One can examine the contents of the ASH buffer in a view named V$ACTIVE_SESSION_HISTORY.
Some Important Columns in the view are
SAMPLE_ID. The unique identifier of the Active Session History record.
SAMPLE_TIME. When Active Session History captured this data on all active sessions.
USER_ID. The numerical user ID (not the username) of the database user who created this session.
SESSION_ID. The session ID (SID) of the session.
SESSION_STATE. The state the session was in when Active Session History took the sample. It shows WAITING if the session was waiting for something; otherwise, it shows ON CPU to indicate that the session was doing productive work.
EVENT. If the session was in a WAITING state (in the SESSION_STATE column), this column will show the wait event the session was waiting for.
TIME_WAITED. If the session was in a WAITING state, this column will show how long it had been waiting when Active Session History took the sample.
WAIT_TIME. If the session is doing productive work—not in a WAITING state—this column will show how long the session waited for the last wait event.
SQL_ID. The ID of the SQL statement the session was executing at the time the sample was taken.
SQL_CHILD_NUMBER. The child number of the cursor. If this is the only version of the cursor, the child number will be 0.
Once we know the time period during which the issue occurred we can identify the database activities using the below query.
col event format a30
col sample_time format a25
select session_id, sample_time, session_state, event, wait_time, time_waited, sql_id, sql_child_number CH#
from v$active_session_history
sample_time between
to_date(’29-SEP-12 04.55.00 PM’,’dd-MON-yy hh:mi:ss PM’)
and
to_date(’29-SEP-12 05.05.00 PM’,’dd-MON-yy hh:mi:ss PM’)
order by sample_time;
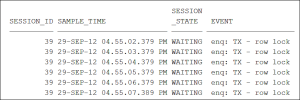
Sample Output


It shows that the session identified by SESSION_ID 39 was waiting for the “enq: TX – row lock contention” event on 29-SEP-12 at 04.55.02.379 PM. Because the session was in a WAITING state, the value of the WAIT_TIME column is irrelevant, so it shows up as 0. Because the session was still in a WAITING state when Active Session History captured the state, the TIME_WAITED column shows 0. When the session finally got the lock, it could do what it had to do and stopped waiting. At that point, the total time the session had waited was updated in Active Session History.You should look at the last occurrence of the wait event (the EVENT column value) for that session in Active Session History to determine what the total wait time really was.Now you explain to your user that the cause of the delay was an unavailable lock during the period 04.55.02.379 PM to 05.16.52.078 PM,
