Introduction/Issue
Integrating Python with Power BI using Anaconda can sometimes be challenging due to compatibility issues and configuration complexities. This blog aims to provide a comprehensive guide to overcoming these challenges, ensuring a smooth integration process.
Why We Need to Do This / Cause of the Issue
The integration of Python with Power BI is essential for leveraging Python’s advanced data analysis and visualization capabilities within Power BI’s robust reporting environment. However, the issue arises because Power BI requires a specific Python environment setup, and Anaconda’s default configurations may not always align with Power BI’s requirements. This can lead to errors when running Python scripts in Power BI, disrupting data analysis workflows and causing frustration for users.
How Do We Solve It
To address this issue, follow these detailed steps to integrate Python with Power BI using Anaconda:
Install Anaconda
Download and install Anaconda from the official Anaconda website. Anaconda is a popular distribution of Python and R for scientific computing and data science.
Activate the Anaconda Environment
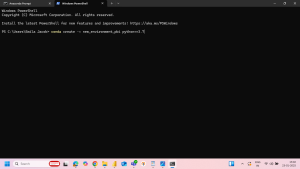
Open Anaconda Prompt.
Create a new environment with the desired Python version by running the following command:
Conda create -n new_environment_pbi python=3.7
Activate your new environment:
Conda activate new_environment_pbi
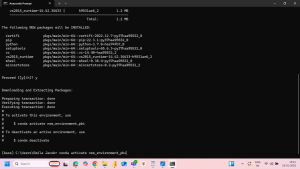
This ensures that the Python environment used by Power BI is the one managed by Anaconda.
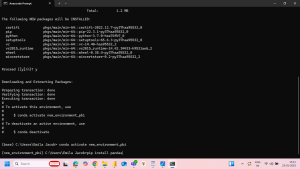
Install Required Libraries
Ensure that necessary libraries like Pandas, Matplotlib, and NumPy are installed in your Anaconda environment. You can do this by running:
pip install pandas
These libraries are essential for data manipulation and visualization in Python.
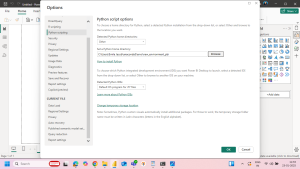
Enable Python Scripting in Power BI
Open Power BI Desktop.
Navigate to File > Options and settings > Options > Python scripting.
Set the Python home directory to your Anaconda installation path, typically
C:\Users\Emila Jacob\anaconda3\envs\new_environment_pbi
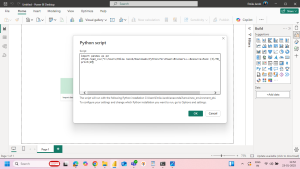
Import Data Using Python
In Power BI, go to Home > Get Data > More > Other > Python script.
Enter your Python script to import data.
For example:
import pandas as pd
df=pd.read_csv(“C:/Users/EmilaJacob/Downloads/Python+for+Power+BI+Users+-+Resource+Pack (3)/HR_file.csv”)
print(df)
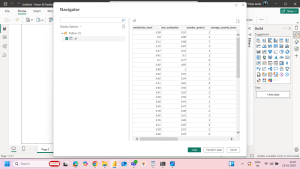
After running the script, select the data frame to load it into Power BI.
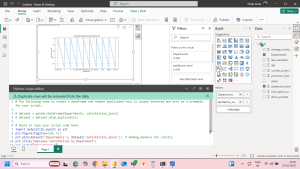
Create Visuals with Python
Use the Python visual icon in the Visualizations pane to create custom visuals.
Write your script in the editor.
For example:
import matplotlib.pyplot as plt
plt.figure(figsize=(10, 5))
plt.plot(dataset[‘Departments’], dataset[‘satisfaction_level’]) # Adding markers for clarity
plt.title(“Employee Satisfaction by Department”)
plt.xlabel(“Departments”)
plt.ylabel(“Satisfaction Level”)
plt.grid(True) # Optional: Adds a grid for better visualization
plt.show()
Conclusion
By configuring Power BI to use the Anaconda environment and ensuring all necessary libraries are installed, you successfully integrate Python into Power BI. This solution streamlines your data analysis process and resolves compatibility issues, allowing for more advanced analytics and visualizations. This approach not only enhances the capabilities of Power BI but also provides a seamless experience for users who rely on Python for data science tasks.