Introduction:
In this blog, we will walk through the process of enabling debug logging and tracing in Oracle APEX applications. Debug logging and tracing are essential techniques for diagnosing problems, understanding application behavior, and improving performance. By capturing detailed logs and execution traces, developers can gain insights into the inner workings of their APEX applications, making it easier to pinpoint and address issues.
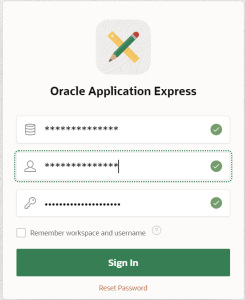
Step 1: In the Browser login into APEX as “DEVELOPER”
Step 2: Run the application which will be running the Report
Take down the URL’s session ID as like below.
“https://***.**.*.**/ords/f?p=521:101:8786047580303:::::”
In my scenario the session ID is 8786047580303
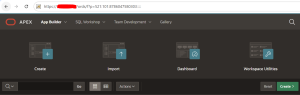
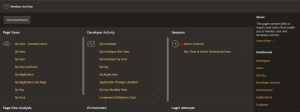
Navigate to Administration–>Monitor Activity as per below snip
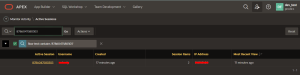
Step 3: Monitor Activity–>Active Sessions
Search for the session ID of Apex runtime “8786047580303”
The screen appears like below.
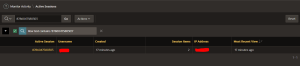
Click on Active session id.
We can find the session details below
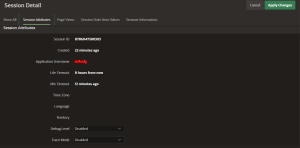
Step 4: Make below changes as per below image attached
Debug Level –>”APEX Trace” & Trace Mode –>”SQL Trace”
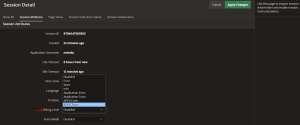
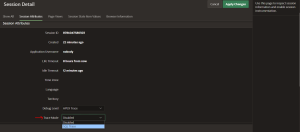
Apply the changes.
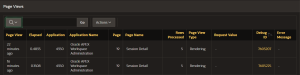
Step 5: After applying changes we can able to see the Debug id as below
Once you click the “Debug ID”, you should be seeing page
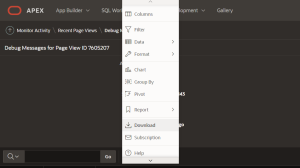
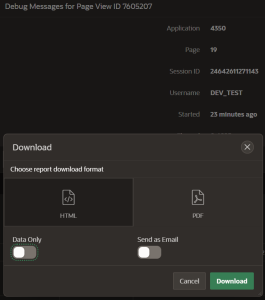
Step 6: Clicking Actions–>Download–>HTML.
Step 7: Finally we can download the trace file as PDF or HTML Format.
Conclusion:
Enabling debug logging and tracing for our Apex application is crucial for effectively diagnosing and resolving runtime issues. By carefully configuring debug logs, we can capture detailed information on code execution, database operations, and other critical components of our environment.This detailed logging allows us to identify and address problems efficiently.