SQL Server execution plans are valuable tools for developers and database administrators aiming to optimize query performance.
However, for beginners, these plans can seem like cryptic maps filled with unfamiliar symbols and terminology. In this guide, we’ll simplify execution plans, explaining their purpose, key components, and how to use them to identify and resolve day to day performance issues.
What is an Execution Plan?
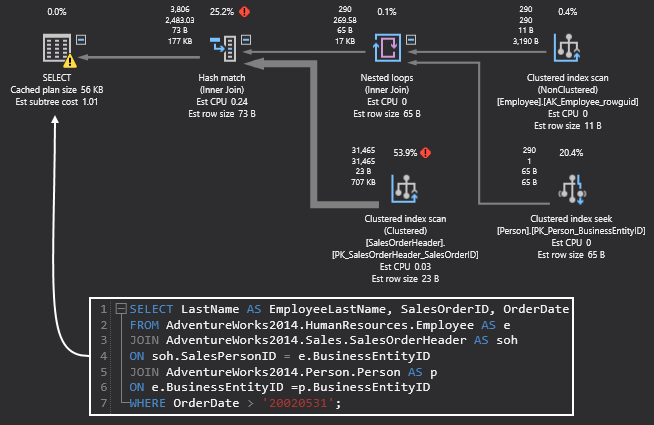
An execution plan is a roadmap that SQL Server uses to execute a query. It provides a visual representation of how SQL Server retrieves, processes, and delivers data. Execution plans are crucial for understanding query performance because they detail the sequence of operations like scans, seeks, joins and data flows.
There are two primary types of execution plans:
Estimated Execution Plan: This plan is generated without executing the query. It shows the query optimizer’s decision on how it plans to execute the query based on available statistics.
Actual Execution Plan: This is generated after the query has executed and includes runtime statistics such as the actual number of rows processed at each step.
Why Are Execution Plans Important?
Execution plans provide valuable insights into how efficiently SQL Server executes a query. Here’s why they’re crucial:
Identify Expensive Operations: Pinpoint costly operations, such as table scans or large hash joins.
Detect Missing Indexes: Highlight areas where new indexes can improve performance.
Analyze Query Behavior: Understand how data flows between steps and what resources are being used.
Optimize Performance: Enable fine-tuning of queries for faster execution times and lower resource consumption.
How to Generate Execution Plans?
Below are the detailed step to generate different execution plans
Estimated Execution Plan:
Click on the “Display Estimated Execution Plan” button (shortcut: Ctrl + L).
Run your query to see the plan without actually executing it.
Actual Execution Plan:
Enable the “Include Actual Execution Plan” option (shortcut: Ctrl + M).
Execute your query to view the plan with runtime statistics.
Additionally, you can use the following T-SQL commands:
For an Estimated Execution Plan:
SET SHOWPLAN_XML ON;
GO
SELECT * FROM Sales.Orders;(Query)
GO
SET SHOWPLAN_XML OFF;
GO
For an Actual Execution Plan:
SET STATISTICS XML ON;
GO
SELECT * FROM Sales.Orders;(Query)
GO
SET STATISTICS XML OFF;
GO
Anatomy of an Execution Plan
1. Operators
Operators are the building blocks of execution plans. Each node in the plan represents an operator, which performs a specific task.
Common operators include:
Table Scan: Reads all rows in a table. Expensive for large datasets and often a sign of missing indexes.
Index Seek: Efficiently retrieves rows using an index.
Clustered Index Scan: Reads all rows in a clustered index. Can be optimized by filtering or indexing.
Nested Loops Join: Iterates through one table for each row in another. Best for small datasets.
Hash Match Join: Builds a hash table for joining large datasets efficiently.
Sort: Orders data, which can be resource-intensive.
2. Arrows
Arrows between operators represent data flow. The thickness of an arrow indicates the volume of data being transferred. Thicker arrows suggest higher data movement, which may be a performance issue.
3. Costs
Each operator shows its relative cost as a percentage of the total query cost. These percentages help prioritize optimization efforts by highlighting the most resource-intensive steps.
Common Performance Issues and Solutions
Table Scans
Problem: Full table scans occur when indexes are missing or not used effectively.
Solution: Create non-clustered indexes based on query predicates.
Expensive Joins
Problem: Join operations like Hash Match Joins can become resource-heavy when datasets are large.
Solution: Use appropriate indexes on join columns and consider query rewriting.
Data Spills to TempDB
Problem: Operations like sorts or joins spill to TempDB due to insufficient memory.
Solution: Increase query memory grants or optimize the query to reduce data size.
Parallelism Issues
Problem: Excessive or insufficient parallelism can lead to inefficiencies.
Solution: Use query hints like MAXDOP or adjust server-level parallelism settings.
Tools for Execution Plan Analysis
Query Store
Query Store is an essential feature for tracking query performance over time. It retains historical execution plans, enabling you to identify regressions and optimize accordingly.
Plan Comparison
Use the “Compare Showplan” feature in SSMS to analyze differences between two execution plans.
Dynamic Management Views (DMVs)
DMVs provide detailed insights into query execution:
select * from sys.dm_exec_query_stats
select * from sys.dm_exec_requests
select * from sys.dm_exec_cached_plans
Conclusion
Execution plans are the important factors for SQL Server queries, showing you the fastest route to retrieve or manipulate your data.
By learning to read and interpret these plans, you can diagnose performance issues, optimize queries, and improve the overall efficiency of your SQL Server environment.
With practice and the right tools, you’ll soon navigate the world of SQL Server execution plans like a pro.
