OIC – Monitoring Costs/Billing Introduction
Introduction:
Controlling costs is important, knowing where your universal credits are being spent is important.
Realising that overage is now charged is important. The OCI Billing Service Metrics for OIC make it easy for us to get a handle on all of this.
Why we need to do:
we have the following Billing related service metrics for OIC –
- Configured Messages – based on Message Packs e.g. 1 Message Pack = 5k Messages
- Total Consumed Message Packs – actual Message Pack consumption, from a billing perspective i.e. Configured + any Overage
- Total Consumed Messages – consumed by all OIC components
- Consumed Messages for Integration – consumed by OIC Integration
- Consumed Message Packs for Disaster Recovery
- Consumed messages for Process Automation and Human in the Loop
- Consumed messages for Decisions
- Consumed messages for Robotic Process Automation
- Consumed messages from data retention
You may not be using all of the OIC components, so you can ignore some of the above.
Imagine if you are using OIC just for integrations, then the following billing metrics are relevant to you.
- Configured Messages – based on Message Packs e.g. 1 Message Pack = 5k Messages
- Total Consumed Message Packs – actual Message Pack consumption, from a billing perspective i.e. Configured + any Overage
- Total Consumed Messages – consumed by all OIC components
- Consumed Messages for Integration – consumed by OIC Integration
You may also be interested in the top nn integrations, from a billing perspective.
How do we solve:
OCI Billing Service Metrics for OIC
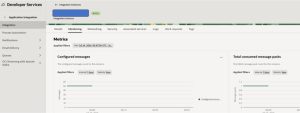
The 4 metrics above can be found, along with the others, in the service instance page in OCI Console. The service metrics for OIC can be divided into 2 broad types – Billing related and technical.
All metrics have filters – the time interval and the statistic. The filters applied by default differ between the metrics. For the Billing filters, the default time interval is one hour; this makes sense as billing is done on an hourly basis.
I just ran an integration 4 times in my Dev instance, so let’s check the billing metric for integrations –
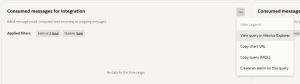
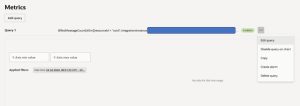
Here we see the internal metric name and the full query –
BilledMessageCount[60m]{resourceId = “yourOIC-OCID“}.grouping().grouping().sum()
I change the time interval to 1m –
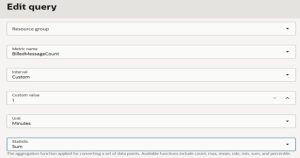
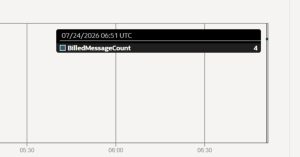
Now I see the billed message count –
Back to Edit Query mode –
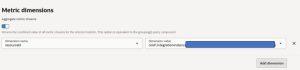
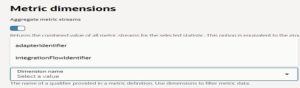
Dimensions allow me to slice and dice the data. Each service metric will have a set of Dimensions one can use. These may differ between metrics.
For BilledMessageCount we have the following –
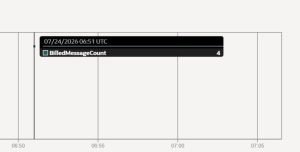
Now I only see the 4, I’m sure you get the idea.
You can create OCI Alarms, based on these metrics –
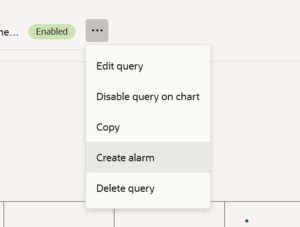
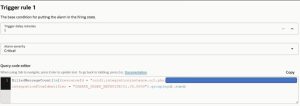
Here you see the updated query and can add a condition, such as –
BilledMessageCount[1m]{resourceId = “yourOIC-OCID“, integrationFlowIdentifier = “CREATE_ORDER_NETSUITE!01.00.0000”}.grouping().sum() > 100
The Alarm can trigger various channels, via OCI Notifications / Subscriptions –
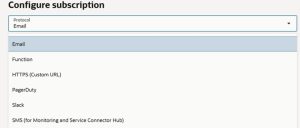
Net, net – your OIC admin will receive an email, if the sum of billed messages for the integration, CREATE_ORDER_NETSUITE!01.00.0000, exceeds 100.