Telegraf is a small tool that collects system and application data and sends it to monitoring tools like Prometheus, Grafana.Telegraf helps you see what is happening inside your server and database. Without monitoring, you find problems only after users complain. With Telegraf, you can spot issues early and fix them before outages happen.
Telegraf is like a messenger that brings system health data to your dashboards.
it can collect:
l CPU and memory usage
l Disk space
l Service status (running or stopped)
l Oracle database metrics (sessions, queries, performance)
# Download Telegraf
Invoke-WebRequest -Uri “https://dl.influxdata.com/telegraf/releases/telegraf-1.28.3_windows_amd64.zip” -OutFile “S:\TEMP\telegraf.zip”
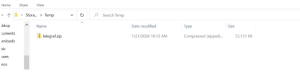
#Extract to Program Files Expand-Archive “$env:TEMP\telegraf.zip” -DestinationPath “C:\Program Files”
# Rename folder for simplicity
Rename-Item “C:\Program Files\telegraf-1.28.3” “C:\Program Files\telegraf” # Install Telegraf as a Windows service
& “C:\Program Files\telegraf\telegraf.exe” –service install
# Start the Telegraf service & “C:\Program Files\telegraf\telegraf.exe” –service start #Configure Telegraf to expose Prometheus metrics Edit the Telegraf config file at: C:\Program Files\telegraf\telegraf.conf [agent]
interval = “15s”
flush_interval = “15s”
[[outputs.prometheus_client]]
listen = “:9161”
metric_version = 2
[[inputs.exec]]
commands = [“C:/telegraf/run_oracle_query.bat”]
timeout = “10s”
data_format = “influx”
#Edit the run_oracle_query.bat
@echo off
sqlplus -S username/password@hostname:1521/service @C:\telegraf\oracle_metrics.sql
Exit
#Edit the oracle_metrics.sql
— ———————-
— Oracle Standard Edition Metrics
— ———————-
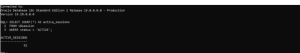
— Sessions
SELECT ‘oracle_sessions_active,host=your-host value=’ || COUNT(*)
FROM v$session
WHERE status=’ACTIVE’;
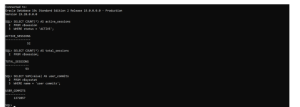
SELECT ‘oracle_sessions_total,host=your-host value=’ || COUNT(*)
FROM v$session;
SELECT ‘oracle_sessions_blocked,host=your-host value=’ || COUNT(*)
FROM v$session
WHERE blocking_session IS NOT NULL;
EXIT
Test configuration before restarting the service: & “C:\Program Files\telegraf\telegraf.exe” –config “C:\Program Files\telegraf\telegraf.conf” –test | Select-Object -First 5
# Restart the Telegraf service
Restart-Service telegraf
#Verify Prometheus scraping Before that add the telegraf information in prometheus.yml global:
scrape_interval: 15s
evaluation_interval: 15s
scrape_configs:
# Prometheus itself
– job_name: “prometheus”
static_configs:
– targets: [“localhost:9090”]
labels:
host: “your-hostname”
app: “prometheus”
# Windows metrics (via windows_exporter)
– job_name: “windows_metrics”
static_configs:
– targets: [“localhost:9182”]
labels:
host: “your-hostname”
env: “environment”
app: “windows”
# Oracle Database metrics
– job_name: “oracle_database-telegraf”
static_configs:
– targets: [“localhost:9161”]
labels:
host: “your-hostname”
env: “environment”
database: “your-db”
app: “oracle”
#Restart Prometheus to apply changes:
sudo systemctl restart prometheus
Then check prometheus is scraping data curl http://your-host:9161/metrics
# HELP go_gc_duration_seconds A summary of the pause duration of garbage collection cycles.
# TYPE go_gc_duration_seconds summary
go_gc_duration_seconds{quantile=”0″} 0
go_gc_duration_seconds{quantile=”0.25″} 0
go_gc_duration_seconds{quantile=”0.5″} 0
go_gc_duration_seconds{quantile=”0.75″} 0
go_gc_duration_seconds{quantile=”1″} 0
go_gc_duration_seconds_sum 0
go_gc_duration_seconds_count 4
# HELP go_goroutines Number of goroutines that currently exist.
# TYPE go_goroutines gauge
go_goroutines 23
# HELP go_info Information about the Go environment.
# TYPE go_info gauge
go_info{version=”go1.21.3″} 1
# HELP go_memstats_alloc_bytes Number of bytes allocated and still in use.
# TYPE go_memstats_alloc_bytes gauge
go_memstats_alloc_bytes 2.7982104e+07
# HELP go_memstats_alloc_bytes_total Total number of bytes allocated, even if freed.
# TYPE go_memstats_alloc_bytes_total counter
go_memstats_alloc_bytes_total 4.0167152e+07
# HELP go_memstats_buck_hash_sys_bytes Number of bytes used by the profiling bucket hash table.
# TYPE go_memstats_buck_hash_sys_bytes gauge
go_memstats_buck_hash_sys_bytes 1.550479e+06
# HELP go_memstats_frees_total Total number of frees.
# TYPE go_memstats_frees_total counter
go_memstats_frees_total 81619
# HELP go_memstats_gc_sys_bytes Number of bytes used for garbage collection system metadata.
# TYPE go_memstats_gc_sys_bytes gauge
go_memstats_gc_sys_bytes 4.314592e+06
# HELP go_memstats_heap_alloc_bytes Number of heap bytes allocated and still in use.
# TYPE go_memstats_heap_alloc_bytes gauge
go_memstats_heap_alloc_bytes 2.7982104e+07
# HELP go_memstats_heap_idle_bytes Number of heap bytes waiting to be used.
# TYPE go_memstats_heap_idle_bytes gauge
go_memstats_heap_idle_bytes 5.824512e+06
# HELP go_memstats_heap_inuse_bytes Number of heap bytes that are in use.
# TYPE go_memstats_heap_inuse_bytes gauge
go_memstats_heap_inuse_bytes 3.149824e+07
# HELP go_memstats_heap_objects Number of allocated objects.
# TYPE go_memstats_heap_objects gauge
go_memstats_heap_objects 41330
# HELP go_memstats_heap_released_bytes Number of heap bytes released to OS.
# TYPE go_memstats_heap_released_bytes gauge
go_memstats_heap_released_bytes 2.351104e+06
# HELP go_memstats_heap_sys_bytes Number of heap bytes obtained from system.
# TYPE go_memstats_heap_sys_bytes gauge
go_memstats_heap_sys_bytes 3.7322752e+07
# TYPE go_memstats_last_gc_time_seconds gauge
go_memstats_last_gc_time_seconds 1.7691045743284495e+09
# HELP go_memstats_lookups_total Total number of pointer lookups.
# TYPE go_memstats_lookups_total counter
go_memstats_lookups_total 0
# HELP go_memstats_mallocs_total Total number of mallocs.
# TYPE go_memstats_mallocs_total counter
go_memstats_mallocs_total 122949
# HELP go_memstats_mcache_inuse_bytes Number of bytes in use by mcache structures.
# TYPE go_memstats_mcache_inuse_bytes gauge
go_memstats_mcache_inuse_bytes 2336
# HELP go_memstats_mcache_sys_bytes Number of bytes used for mcache structures obtained from system.
# TYPE go_memstats_mcache_sys_bytes gauge
go_memstats_mcache_sys_bytes 16352
# HELP go_memstats_mspan_inuse_bytes Number of bytes in use by mspan structures.
# TYPE go_memstats_mspan_inuse_bytes gauge
go_memstats_mspan_inuse_bytes 182784
# HELP go_memstats_mspan_sys_bytes Number of bytes used for mspan structures obtained from system.
# TYPE go_memstats_mspan_sys_bytes gauge
go_memstats_mspan_sys_bytes 195552
# HELP go_memstats_next_gc_bytes Number of heap bytes when next garbage collection will take place.
# TYPE go_memstats_next_gc_bytes gauge
go_memstats_next_gc_bytes 6.2423512e+07
# HELP go_memstats_other_sys_bytes Number of bytes used for other system allocations.
# TYPE go_memstats_other_sys_bytes gauge
go_memstats_other_sys_bytes 701912
# HELP go_memstats_stack_inuse_bytes Number of bytes in use by the stack allocator.
# TYPE go_memstats_stack_inuse_bytes gauge
go_memstats_stack_inuse_bytes 425984
# HELP go_memstats_stack_sys_bytes Number of bytes obtained from system for stack allocator.
# TYPE go_memstats_stack_sys_bytes gauge
go_memstats_stack_sys_bytes 425984
# HELP go_memstats_sys_bytes Number of bytes obtained from system.
# TYPE go_memstats_sys_bytes gauge
go_memstats_sys_bytes 4.4527623e+07
# HELP go_threads Number of OS threads created.
# TYPE go_threads gauge
go_threads 9
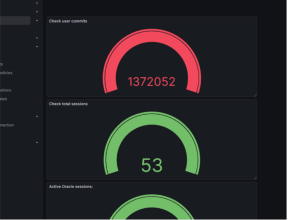
# HELP oracle_sessions_active_value Telegraf collected metric
# TYPE oracle_sessions_active_value untyped
oracle_sessions_active_value{host=”your-host”} 52
# HELP oracle_sessions_total_value Telegraf collected metric
# TYPE oracle_sessions_total_value untyped
oracle_sessions_total_value{host=”your-host”} 53
# HELP oracle_user_commits_value Telegraf collected metric
# TYPE oracle_user_commits_value untyped
oracle_user_commits_value{host=”your-host”} 1.371848e+06
# HELP process_cpu_seconds_total Total user and system CPU time spent in seconds.
# TYPE process_cpu_seconds_total counter
process_cpu_seconds_total 1.484375
# HELP process_max_fds Maximum number of open file descriptors.
# TYPE process_max_fds gauge
process_max_fds 1.6777216e+07
# HELP process_open_fds Number of open file descriptors.
# TYPE process_open_fds gauge
process_open_fds 178
# HELP process_resident_memory_bytes Resident memory size in bytes.
# TYPE process_resident_memory_bytes gauge
process_resident_memory_bytes 9.2966912e+07
# HELP process_start_time_seconds Start time of the process since unix epoch in seconds.
# TYPE process_start_time_seconds gauge
process_start_time_seconds 1.769104333e+09
# HELP process_virtual_memory_bytes Virtual memory size in bytes.
# TYPE process_virtual_memory_bytes gauge
process_virtual_memory_bytes 6.4049152e+07
##Grafana Configuration Check Target server and monitoring server