Introduction/ Issue:
Developing a BIP report in Fusion to identify component demand shortages for assembly items and improve supply planning decisions.
Why we need to do / Cause of the issue:
In supply chain planning, one of the major challenges faced by supply teams is the sudden shortage of components required to build critical assembly items. Although demand exists at the assembly level, the corresponding component-level demand and shortages are often not visible in a single, consolidated view. This lack of visibility makes it difficult for supply planners to take timely action, leading to last-minute firefighting, delayed production, and potential customer impact. To address this gap, the Assembly and Component Demand Summary Report is designed to clearly showcase component demand shortages for specific assembly items, enabling proactive supply planning.
How do we solve:
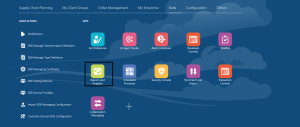
- Login to Oracle Fusion and Navigate to Reports and Analytics under Tools
- Click on Browse Catalog. This will open analytics page. Now click on Create and select Data Model

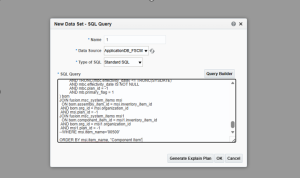
- Click on plus icon and select SQL Query

4. Select the Data source as ApplicationDB_FSCM and Use the following query
SELECT DISTINCT
msi.item_name AS “Assembly Item”,
msi.description AS “Assembly Item Desc”,
msi.organization_code AS “Assembly Item Org”,
msi1.item_name AS “Component Item”,
msi1.description AS “Component Item Desc”,
msi1.organization_code AS “Component Org”,
— Component Category: Purchasing category if exists, otherwise default
(
SELECT NVL(
MAX(CASE
WHEN UPPER(mcs.category_set_name) LIKE ‘%PURCHASING%’
THEN mcc.category_name
END),
‘No Purchasing Category’)
FROM fusion.msc_item_categories mic
LEFT JOIN fusion.msc_catalog_categories mcc
ON mic.category_id = mcc.category_id
LEFT JOIN fusion.msc_category_sets mcs
ON mcc.category_set_id = mcs.category_set_id
WHERE mic.inventory_item_id = msi1.inventory_item_id
AND mic.organization_id = msi1.organization_id
) AS “Component Category”,
msi1.life_cycle_phase AS “Component Status”,
bom.component_quantity AS “Component Usage Quantity”,
msi.life_cycle_phase AS “Assembly Status”,
— Assembly on-hand
ROUND(NVL((SELECT MAX(d.onhand)
FROM fusion.msc_data_1_dyd d
WHERE d.prd_lvl_member_id = msi.inventory_item_id
AND d.org_lvl_member_id = msi.organization_id), 0), 4) AS “Assembly Onhand”,
— Component on-hand
ROUND(NVL((SELECT MAX(d.onhand)
FROM fusion.msc_data_1_dyd d
WHERE d.prd_lvl_member_id = msi1.inventory_item_id
AND d.org_lvl_member_id = msi1.organization_id), 0), 4) AS “Component Onhand”,
— Demand next 10 days
ROUND(NVL((SELECT SUM(d.total_demand)
FROM fusion.msc_data_1_dyd d
JOIN fusion.msc_dimension_tim_dyd t
ON d.tim_lvl_member_id = t.tim_lvl_member_id
WHERE d.prd_lvl_member_id = msi1.inventory_item_id
AND d.org_lvl_member_id = msi1.organization_id
AND t.from_date BETWEEN TRUNC(SYSDATE) AND TRUNC(SYSDATE)+10), 0), 4) AS “Demand Next 10 Days”,
— Demand shortage
(ROUND(NVL((SELECT MAX(d.onhand)
FROM fusion.msc_data_1_dyd d
WHERE d.prd_lvl_member_id = msi1.inventory_item_id
AND d.org_lvl_member_id = msi1.organization_id), 0), 4)
-ROUND(NVL((SELECT SUM(d.total_demand)
FROM fusion.msc_data_1_dyd d
JOIN fusion.msc_dimension_tim_dyd t
ON d.tim_lvl_member_id = t.tim_lvl_member_id
WHERE d.prd_lvl_member_id = msi1.inventory_item_id
AND d.org_lvl_member_id = msi1.organization_id
AND t.from_date BETWEEN TRUNC(SYSDATE) AND TRUNC(SYSDATE)+10), 0), 4)
) AS “Demand Shortage”,
— Demand next 1 month
ROUND(NVL((SELECT SUM(d.total_demand)
FROM fusion.msc_data_1_dyd d
JOIN fusion.msc_dimension_tim_dyd t
ON d.tim_lvl_member_id = t.tim_lvl_member_id
WHERE d.prd_lvl_member_id = msi1.inventory_item_id
AND d.org_lvl_member_id = msi1.organization_id
AND t.from_date BETWEEN TRUNC(SYSDATE) AND ADD_MONTHS(TRUNC(SYSDATE), 1)), 0), 4) AS “Demand Next 1 Month”,
— Demand next 3 months
ROUND(NVL((SELECT SUM(d.total_demand)
FROM fusion.msc_data_1_dyd d
JOIN fusion.msc_dimension_tim_dyd t
ON d.tim_lvl_member_id = t.tim_lvl_member_id
WHERE d.prd_lvl_member_id = msi1.inventory_item_id
AND d.org_lvl_member_id = msi1.organization_id
AND t.from_date BETWEEN TRUNC(SYSDATE) AND ADD_MONTHS(TRUNC(SYSDATE), 3)), 0), 4) AS “Demand Next 3 Months”,
— Demand next 6 months
ROUND(NVL((SELECT SUM(d.total_demand)
FROM fusion.msc_data_1_dyd d
JOIN fusion.msc_dimension_tim_dyd t
ON d.tim_lvl_member_id = t.tim_lvl_member_id
WHERE d.prd_lvl_member_id = msi1.inventory_item_id
AND d.org_lvl_member_id = msi1.organization_id
AND t.from_date BETWEEN TRUNC(SYSDATE) AND ADD_MONTHS(TRUNC(SYSDATE), 6)), 0), 4) AS “Demand Next 6 Months”
FROM (
SELECT
mb.assembly_item_id,
mbc.inventory_item_id AS component_item_id,
mbc.usage_quantity AS component_quantity,
mb.organization_id AS org_id
FROM
msc_item_structures mb
JOIN msc_bom_components mbc
ON mb.bill_sequence_id = mbc.bill_sequence_id
AND mb.assembly_item_id = mbc.using_assembly_id
AND mb.assembly_type = 1
AND mb.organization_id = mbc.organization_id
AND (TRUNC(mbc.disable_date) > TRUNC(SYSDATE) OR mbc.disable_date IS NULL)
AND TRUNC(mbc.effectivity_date) <= TRUNC(SYSDATE)
AND mbc.effectivity_date IS NOT NULL
AND mbc.plan_id = -1
AND mb.primary_flag = 1
) bom
JOIN fusion.msc_system_items msi
ON bom.assembly_item_id = msi.inventory_item_id
AND bom.org_id = msi.organization_id
AND msi.plan_id = -1
JOIN fusion.msc_system_items msi1
ON bom.component_item_id = msi1.inventory_item_id
AND bom.org_id = msi1.organization_id
AND msi1.plan_id = -1
–WHERE msi.item_name=’00500′
ORDER BY msi.item_name, “Component Item”
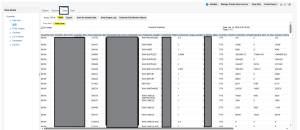
- Click on Data tab and view the data
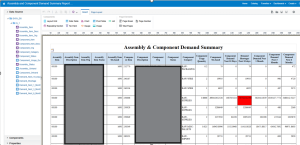
6. Save the data model, then click Save as Sample Data followed by Create Report. Drag and drop the required columns into the report layout and save the report. If any changes are required, such as applying conditional formatting, reopen the report in Edit mode and make the necessary updates.
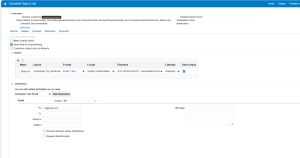
7. If the report needs to be scheduled for end users, save both the data model and the report under the Custom folder in Shared Folders. Then, click the More option on the report, select Schedule, add the required email recipients, and choose the schedule frequency.

Conclusion:
The Assembly and Component Demand Summary BIP report provides a consolidated view of assembly and component-level demand, enabling early identification of potential shortages. This helps reduce delays, prevent sudden shortages, and improve overall supply chain efficiency.