Introduction:
When it comes to database performance tuning, that’s where Query Store appears. Introduced in 2017 version and significantly enhanced in 2019, Query Store acts like a “flight recorder” for your SQL Server database — capturing query execution history, performance metrics, and execution plan changes over time.
Scenario
We had a requirement to capture slow and resource-intensive queries on a production server. To address this, we enabled Query Store on the relevant database in the production environment. This allowed us to track query performance over time, identify performance regressions, and gain better insights into high-impact workloads.
Steps to Enable Query Store
Option 1: Using SQL Server Management Studio (SSMS)
- Open SSMS and connect to your SQL Server instance.
- In Object Explorer, expand the Databases node.
- Right-click the database where you want to enable Query Store and select Properties.
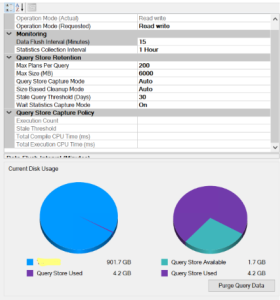
- In the Database Properties dialog, click on the Query Store page (on the left).
- Set Operation Mode (Requested) to Read Write.
- Adjust other options as needed (optional):
- Size Based Cleanup Mode: AUTO or OFF
- Max Size (MB): how much space it can use
- Query Store Capture Mode: ALL, AUTO, or NONE
- Click OK to apply.
Option 2: Using T-SQL
ALTER DATABASE [YourDatabaseName]
SET QUERY_STORE = ON;
ALTER DATABASE [YourDatabaseName]
SET QUERY_STORE (OPERATION_MODE = READ_WRITE);
Advanced options like this:
ALTER DATABASE [YourDatabaseName]
SET QUERY_STORE = ON (
OPERATION_MODE = READ_WRITE,
CLEANUP_POLICY = (STALE_QUERY_THRESHOLD_DAYS = 30),
DATA_FLUSH_INTERVAL_SECONDS = 900,
MAX_STORAGE_SIZE_MB = 100,
INTERVAL_LENGTH_MINUTES = 15,
QUERY_CAPTURE_MODE = AUTO
);
Confirm It’s Enabled
You can verify with this query:
SELECT actual_state_desc, desired_state_desc, readonly_reason
FROM sys.database_query_store_options;
Points to note:
- Query Store is available in SQL Server 2016 and newer.
- Not supported in system databases like master or tempdb.
- Useful for tracking query regressions, forced plan usage and Tracking Queries
- 1–2% of total database size is a safe and typical starting point, and we need to adjust based on workload complexity, number of distinct queries, frequency of plan changes, and required retention.
Key Settings:
| Option | Recommended Value | Why |
| OPERATION_MODE | READ_WRITE | Enables full tracking and plan forcing |
| QUERY_CAPTURE_MODE | AUTO | Captures important queries without overloading storage |
| STALE_QUERY_THRESHOLD_DAYS | 30 | Deletes query data older than 30 days to conserve space |
| MAX_STORAGE_SIZE_MB | Depends on the Size fo the DB | Scale up for large databases or high query volume |
| DATA_FLUSH_INTERVAL_SECONDS | 900 | Less frequent flushes reduce I/O pressure |
| INTERVAL_LENGTH_MINUTES | 15 | Provides useful granularity for tracking trends |
| SIZE_BASED_CLEANUP_MODE | AUTO | Automatically cleans up oldest data if max size is hit |
Special Cases
OLTP (High Transactional Load)
- Use QUERY_CAPTURE_MODE = AUTO or NONE during peak hours to avoid overhead.
- Monitor for performance impact and adjust flush interval and capture mode as needed.
Reporting/Analytics Workload
- Use QUERY_CAPTURE_MODE = ALL during workload analysis windows to capture full details.
- Consider increasing MAX_STORAGE_SIZE_MB (e.g., 2000+).
To View Captured Queries in Query Store:
SELECT
q.query_id,
q.query_hash,
qt.query_sql_text,
p.plan_id,
rs.avg_duration,
rs.execution_type_desc
FROM sys.query_store_query q
JOIN sys.query_store_query_text qt ON q.query_text_id = qt.query_text_id
JOIN sys.query_store_plan p ON q.query_id = p.query_id
JOIN sys.query_store_runtime_stats rs ON p.plan_id = rs.plan_id
ORDER BY rs.avg_duration DESC;
Use SSMS GUI
In SQL Server Management Studio:
- Right-click on the database → Properties → Query Store
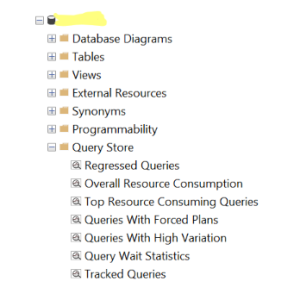
- View:
- Tracked Queries
- Top Resource Consuming Queries
- Query Plans
- Regressions, etc.

Monitoring Query Store Health
You can monitor Query Store usage with this query
SELECT *
FROM sys.database_query_store_options;
Check space usage:
SELECT
current_storage_size_mb, max_storage_size_mb
FROM sys.database_query_store_options;
Periodically monitor usage and trends:
SELECT
actual_state_desc,
current_storage_size_mb,
max_storage_size_mb,
readonly_reason,
flush_interval_seconds,
stale_query_threshold_days
FROM sys.database_query_store_options;
If current_storage_size_mb approaches the max_storage_size_mb, consider increasing it or adjusting to the cleanup policy.
Common Ways to Use Query Store
- Analyze Query Performance
— Your current query shows top queries by last execution
SELECT TOP 10
qt.query_sql_text,
q.query_id,
p.plan_id,
rs.avg_duration,
rs.last_execution_time
FROM sys.query_store_query q
JOIN sys.query_store_query_text qt ON q.query_text_id = qt.query_text_id
JOIN sys.query_store_plan p ON q.query_id = p.query_id
JOIN sys.query_store_runtime_stats rs ON p.plan_id = rs.plan_id
ORDER BY rs.last_execution_time DESC;
But there are many variations, such as:
- Top queries by CPU time:
SELECT TOP 10 qt.query_sql_text, rs.avg_cpu_time
FROM sys.query_store_runtime_stats rs
JOIN sys.query_store_plan p ON rs.plan_id = p.plan_id
JOIN sys.query_store_query q ON p.query_id = q.query_id
JOIN sys.query_store_query_text qt ON q.query_text_id = qt.query_text_id
ORDER BY rs.avg_cpu_time DESC;
- Queries with multiple plans (potentially unstable performance):
SELECT query_id, COUNT(DISTINCT plan_id) AS plan_count
FROM sys.query_store_plan
GROUP BY query_id
HAVING COUNT(DISTINCT plan_id) > 1;
- Use Built-in SSMS Reports
If you’re using SQL Server Management Studio (SSMS):
Go to:
Database → Right Click → Reports → Standard Reports → Query Store
Reports include:
- Regressed Queries
- Top Resource-Consuming Queries
- Overall Resource Consumption
- Queries with Forced Plans
- Force a Specific Plan
If you find a “good” plan, you can force it to avoid regressions:
EXEC sp_query_store_force_plan @query_id = 123, @plan_id = 456;
To undo it:
EXEC sp_query_store_unforce_plan @query_id = 123, @plan_id = 456;
- Cleanup & Maintenance
You can purge stale data or reset Query Store:
- Remove old data:
ALTER DATABASE AdventureWorks2016 SET QUERY_STORE
(CLEANUP_POLICY = (STALE_QUERY_THRESHOLD_DAYS = 7));
- Clear all data:
ALTER DATABASE AdventureWorks2016 SET QUERY_STORE CLEAR;
- Enable Automatic Plan Correction (Applicable for Enterprise Edition)
Automatically force better-performing plans when regressions are detected:
ALTER DATABASE AdventureWorks2016
SET AUTOMATIC_TUNING ( FORCE_LAST_GOOD_PLAN = ON );
Conclusion
Enabling Query Store on SQL Server 2019 has proven to be a valuable step in monitoring and improving query performance in our production environment. By capturing historical execution data and resource usage patterns, Query Store helps us quickly identify slow-running or regressed queries and take corrective action with confidence.
Whether you’re troubleshooting performance issues or planning proactive optimizations, Query Store provides the visibility and control needed to maintain a healthy and efficient SQL Server environment.