Introduction/ Issue
In many business scenarios—such as tracking campaign end dates, monitoring service expiry, or counting down to a project milestone—users want a quick, visual way to see how much time is left. Without a countdown, users must manually calculate dates or rely on static reports, which can cause delays and reduce dashboard usability.
Why we need to do / Cause of the issue
The issue occurs because Power BI’s built-in visuals do not include a timer feature. We need to create a custom DAX measure that calculates the difference between the current date/time and the target date/time and then present it clearly in a visual.
How do we solve
Step 1 – Ensure Data Contains a Target Date/Time
In our dataset, we have a field messages [TargetDateTime] containing the deadline or event date/time.
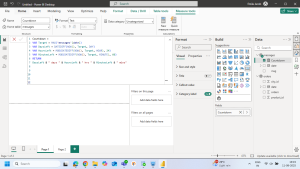
Step 2 – Create a Countdown Measure
Go to Modelling → New Measure and enter:
Countdown =

VAR Target = MAX(messages[TargetDateTime])

VAR DaysLeft = DATEDIFF(NOW(), Target, DAY)

VAR HoursLeft = MOD(DATEDIFF(NOW(), Target, HOUR), 24)

VAR MinutesLeft = MOD(DATEDIFF(NOW(), Target, MINUTE), 60)

RETURN

DaysLeft & " days " & HoursLeft & " hrs " & MinutesLeft & " mins"
This calculates the remaining days, hours, and minutes dynamically.
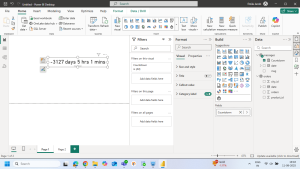
Step 3 – Add the Card Visual
- From the Visualizations pane, select Card.
- Drag the Countdown measure into Values.
- Adjust font size, alignment, and colors in the Format pane to make it prominent.
Conclusion
By creating a DAX-based countdown timer and displaying it in a simple Card visual, we overcame the lack of a native timer visual in Power BI. This solution dynamically updates every time the report refreshes, ensuring that users always see the latest countdown to their event or deadline. It’s an effective, lightweight approach that works even for personal Power BI licenses without requiring custom visuals or additional plugins.