Troubleshooting High Disk Queue Depth in SQL Server
Introduction
This document helps to find and fix high disk queue depth problems in SQL Server. These issues can slow down the system. With the help of Foglight and SQL queries, we can check what is causing the problem and take steps to improve performance.
Step 1: Confirm High Disk Queue Depth in Foglight
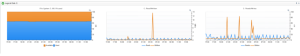
Navigate to: Foglight > SQL Server > Resources > Disk
Check for consistent spikes in Disk Queue Depth metric (e.g., > 94)
Confirm affected volume(s) and duration of spikes

Step 2: Identify Top I/O Consuming Queries
— Top 10 queries by I/O usage
SELECT TOP 10 qs.total_logical_reads + qs.total_logical_writes AS TotalIO, qs.execution_count, qs.total_elapsed_time / qs.execution_count AS AvgDuration_ms, SUBSTRING(st.text, (qs.statement_start_offset/2)+1, ((CASE qs.statement_end_offset WHEN -1 THEN DATALENGTH(st.text) ELSE qs.statement_end_offset END – qs.statement_start_offset)/2)+1) AS QueryText FROM sys.dm_exec_query_stats qs CROSS APPLY sys.dm_exec_sql_text(qs.sql_handle) st ORDER BY TotalIO DESC;
Step 3: Monitor File-Level I/O Stats
— Check latency per file
SELECT DB_NAME(fs.database_id) AS DatabaseName, mf.physical_name, fs.io_stall_read_ms, fs.num_of_reads, fs.io_stall_write_ms, fs.num_of_writes, (fs.io_stall_read_ms / NULLIF(fs.num_of_reads, 0)) AS AvgReadLatency_ms, (fs.io_stall_write_ms / NULLIF(fs.num_of_writes, 0)) AS AvgWriteLatency_ms FROM sys.dm_io_virtual_file_stats(NULL, NULL) fs JOIN sys.master_files mf ON fs.database_id = mf.database_id AND fs.file_id = mf.file_id ORDER BY AvgReadLatency_ms DESC;
Step 4: Check Wait Stats for I/O-Related Waits
— Top waits to confirm PAGEIOLATCH_*, WRITELOG, etc.
SELECT TOP 10 wait_type, wait_time_ms/1000.0 AS WaitTime_sec, 100.0 * wait_time_ms / SUM(wait_time_ms) OVER() AS WaitPercentage, signal_wait_time_ms/1000.0 AS SignalWaitTime_sec FROM sys.dm_os_wait_stats WHERE wait_type NOT IN (‘CLR_SEMAPHORE’,’LAZYWRITER_SLEEP’,’RESOURCE_QUEUE’,’SLEEP_TASK’,’SLEEP_SYSTEMTASK’,’SQLTRACE_BUFFER_FLUSH’,’WAITFOR’,’LOGMGR_QUEUE’,’CHECKPOINT_QUEUE’,’REQUEST_FOR_DEADLOCK_SEARCH’,’XE_TIMER_EVENT’,’BROKER_TO_FLUSH’,’BROKER_TASK_STOP’,’CLR_MANUAL_EVENT’,’CLR_AUTO_EVENT’,’DISPATCHER_QUEUE_SEMAPHORE’,’FT_IFTS_SCHEDULER_IDLE_WAIT’,’XE_DISPATCHER_WAIT’,’XE_DISPATCHER_JOIN’,’SQLTRACE_INCREMENTAL_FLUSH_SLEEP’,’WAIT_XTP_HOST_WAIT’) ORDER BY WaitTime_sec DESC;
Step 5: Take Action Based on Findings
Query Tuning:
Rewrite inefficient queries (e.g., full table scans, missing indexes)
Avoid large sorts/spools/tempdb usage
Indexing:
Add or adjust indexes based on execution plan
Storage Improvements:
Move hot files to faster storage (SSD/NVMe)
Scale up IOPS or throughput via storage tiering
TempDB Optimization:
Ensure multiple data files (8 recommended for >8 CPUs)
Monitor for tempdb contention
Conclusion
By following these steps, we can solve high disk queue depth issues and make SQL Server run faster. Regular checks and proper tuning will help keep the system healthy and responsive.