INTRODUCTION:
Knowing how your content is being used helps you demonstrate your impact and prioritize your efforts. Your usage metrics may show that one of your reports is used daily by a huge segment of the organization. It may show that nobody is viewing a dashboard you created at all. This type of feedback is invaluable in guiding your work efforts.
If you create reports in workspaces, you have access to improved usage metrics reports. They enable you to discover who’s using those reports throughout your organization, and how they’re using them. You can also identify high-level performance issues. The improved usage reports for shared workspaces replace the usage metrics reports documented in Monitor report usage metrics.
Note
- You need a Power BI Pro or Premium Per User (PPU) license to run and access the usage metrics data.
- However, the usage metrics feature captures usage information from all users, regardless of the license they’re assigned.
- To access usage metrics for a report, you must have edit access to the report.
- Your Power BI admin must have enabled usage metrics for content creators. Your Power BI admin may have also enabled collecting per-user data in usage metrics
WHY DO WE NEED THIS SOLUTION:
Usage metrics in Power BI are important because they provide insight into how users are interacting with your reports and dashboards, allowing you to identify which content is being used most frequently, by whom, and when, which helps you optimize your reports, prioritize development efforts, and understand the impact of your BI initiatives within the organization.
Key benefits of using Power BI usage metrics:
Identify valuable reports:
Understand which reports are most frequently accessed and used by users, allowing you to focus on improving and maintaining those key reports.
Improve report design:
Analyze user behavior to identify areas where reports may be confusing or lack necessary information, leading to better design and user experience.
Monitor user engagement:
Track which users are actively engaging with your reports and dashboards, identifying potential gaps in training or areas where specific user groups may need additional support.
Prioritize development efforts:
Allocate resources effectively by focusing on developing new reports or features that address the most pressing user needs based on usage data.
Demonstrate impact:
Use usage metrics to showcase the value of your Power BI reports to stakeholders by highlighting how widely they are being used
HOW DO WE SOLVE THIS:
Only users with admin, member, or contributor permissions can view the usage metrics report. Viewer permissions aren’t enough. If you’re at least a contributor in a workspace in which your report resides, you can use the following procedure to display the usage metrics:
- Open the workspace that contains the report for which you want to analyze the usage metrics.
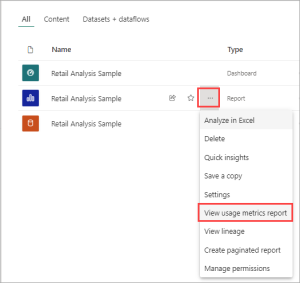
- From the workspace content list, select More options (…)for the report and select View usage metrics report.
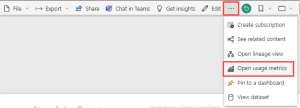
Or open the report, then on the command bar, select More options (…) > Open usage metrics.
- The first time you do this; Power BI creates the usage metrics report and lets you know when it’s ready.
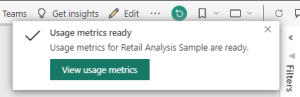
- To see the results, select View usage metrics.
- If this is the first time you’ve viewed a usage metrics report, Power BI might open the old usage metrics report. To display the improved usage metrics report, in the upper right corner, toggle the New usage reportswitch to On.
About the new usage metrics report
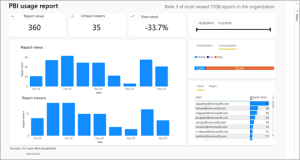
When you display the usage metrics report, Power BI generates a pre-built report. It contains usage metrics for that content for the last 30 days. The report looks similar to the Power BI reports you’re already familiar with. You can slice based on how your end users received access, whether they accessed via the web or mobile app, and so on. As your reports evolve, so too will the usage metrics report. It updates every day with new data.
Note
Usage metrics reports don’t show up in Recent, Workspaces, Favorites, or other content lists. They can’t be added to an app. If you pin a tile from a usage metrics report to a dashboard, you can’t add that dashboard to an app.
Create and view a new usage metrics report
Only users with admin, member, or contributor permissions can view the usage metrics report. Viewer permissions aren’t enough. If you’re at least a contributor in a workspace in which your report resides, you can use the following procedure to display the usage metrics:
- Open the workspace that contains the report for which you want to analyze the usage metrics.
- From the workspace content list, select More options (…)for the report and select View usage metrics report.
Or open the report, then on the command bar, select More options (…) > Open usage metrics.
- The first time you do this, Power BI creates the usage metrics report and lets you know when it’s ready.
- To see the results, select View usage metrics.
- If this is the first time you’ve viewed a usage metrics report, Power BI might open the old usage metrics report. To display the improved usage metrics report, in the upper right corner, toggle the New usage reportswitch to On.
About the new usage metrics report
When you display the usage metrics report, Power BI generates a pre-built report. It contains usage metrics for that content for the last 30 days (about 4 and a half weeks). The report looks like the Power BI reports you’re familiar with. You can slice based on how your end users received access, whether they accessed via the web or mobile app, and so on. As your reports evolve, so will the usage metrics report. It updates every day with new data.
Note
Usage metrics reports don’t show up in Recent, Workspaces, Favorites, or other content lists. They can’t be added to an app. If you pin a tile from a usage metrics report to a dashboard, you can’t add that dashboard to an app.
Update usage metrics report credentials
If semantic model owners in your workspace leave, are no longer a part of your organization, or if the credentials expire, the semantic models may become stale and refreshes may fail.
In such cases, you can use the following procedure to take over a Usage Metrics Report semantic model and update the credentials.
- Open the workspace that contains the report for which you want to update the Usage Metrics Report semantic model.
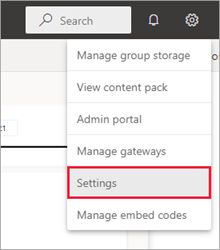
- In the gray header bar at the top, select the Settings icon, then select Settings.
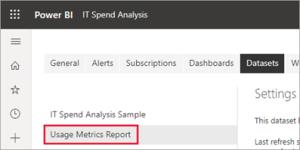
- Switch to the Semantic models tab.
- Select the Usage Metrics Report semantic model.
If you aren’t the current semantic model owner, you must take over ownership before you can update the data source credentials.
- Select the Take overbutton, then in the Take over semantic model settings dialog box, select Take over again.
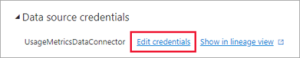
- Under Data source credentials, select Edit credentials.
- In the Configure Usage Metrics Report dialog box, select Sign in.
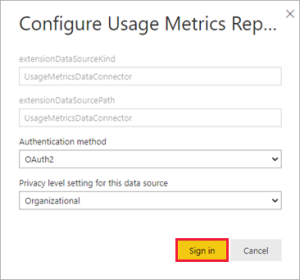
- Complete the signin sequence and note the notification that the data source was updated successfully.
Note: The Usage Metrics Report semantic model contains usage data for the last 30 days. It can take up to 24 hours for new usage data to be imported. You can’t trigger a manual refresh by using the Power BI user interface
Customize the usage metrics report
To dig into the report data, or to build your own reports against the underlying semantic model, you have several options:
Make a copy of the report in the Power BI service. Use Save a copy to create a separate instance of the usage metrics report, which you can customize to meet your specific needs.
Connect to the semantic model with a new report. For every workspace, the semantic model has the name “Usage Metrics Report,” as explained earlier in the section Usage metrics report semantic model. You can use Power BI Desktop to build custom usage metrics reports based on the underlying semantic model.
Use Analyze in Excel. You can also analyze the Power BI usage data in PivotTables, charts, and slicer features in Microsoft Excel. Read more about the Analyze in Excel feature.
Create a copy of the usage report
When you create a copy of the read-only, pre-built usage report, Power BI creates an editable instance of the report. At first glance, it looks the same. However, you can now open the report in Editing view, add new visualizations, filters, and pages, modify or delete existing visualizations, and so on. Power BI saves the new report in the current workspace.
- In the usage metrics report, select the File dropdown, then select Save a copy.
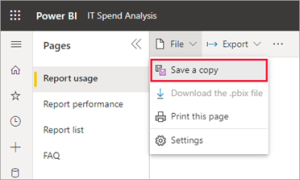
- In the Save your report dialog box, enter a name, then select Save.
Power BI creates an editable Power BI report saved in the current workspace. Select Go to report in the Report saved dialog box that appears.
- Select Edit to switch into Editing view.
From here you can change filters, add new pages, build new visualizations, format the fonts and colors, and so on.
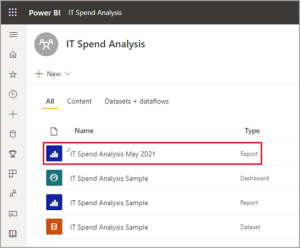
- The new report is saved to the All tab and the Content tab in the current workspace and added to the Recent list.
Note :When you save a copy of the usage metrics report:
The report is treated like a regular Power BI report. It will be accessible to all users who have viewing permissions in the workspace, including users in the Viewer role.The report is built on the original semantic model. If there are any changes from Power BI, this may break your copy of the report.
Filter out pseudo-duplicates
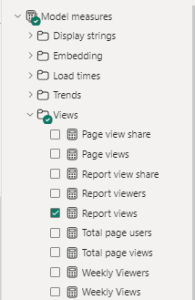
To remove pseudo-duplicates from the Usage Report, you can add a Report views measure to filter them out.
Under Model measures, expand Views, and add Report views to the Filters pane.
Create a usage report in Power BI Desktop
You can create a usage report in Power BI Desktop, based on the Usage Metrics Report semantic model. To establish a connection to the Usage Metrics Report semantic model and create your own report, you have to be signed in to the Power BI service in Power BI Desktop.
- Open Power BI Desktop.
- If you aren’t signed in to the Power BI service, on the Filemenu select Sign in.
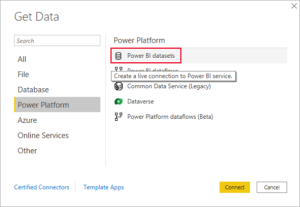
- To connect to the Usage Metrics Report semantic model, on the Homeribbon select Get Data > More.
- In the left pane, select Power Platform, then select Power BI semantic models> Connect.
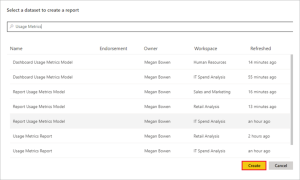
- Scroll to the desired semantic model or type Usage Metricsin the search box.
- Verify in the Workspace column that you’re selecting the correct semantic model, then select Create.
- Check the Fields list in Power BI Desktop, which gives you access to the tables, columns, and measures in the selected semantic model.
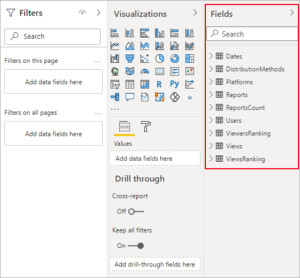
- Now you can create and share custom usage reports, all from the same Usage Metrics Reportsemantic model.
Note:When you create a usage metrics report, it’s built on the original semantic model. If there are any changes from Power BI, this may break your copy of the report.
Analyze usage data in Excel
When you connect to the usage data in Excel, you can create PivotTables that use the pre-defined measures. Note that Excel PivotTables do not support drag-and-drop aggregation of numeric fields when connecting to a Power BI semantic model.
- First, if you haven’t done so already, create a copy of the usage metrics report.
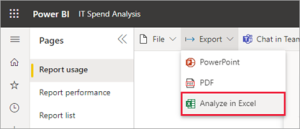
- Open the usage metrics report, select Export> Analyze in Excel.
- If you see the First, you need some Excel updates dialog box, select Download and install the latest updates for Power BI connectivity. Otherwise, select I’ve already installed these updates.
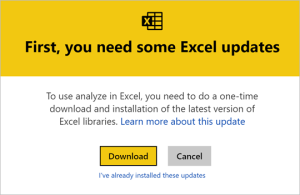
Note: Some organizations may have Group Policy rules that prevent installing the required Analyze in Excel updates to Excel. If you can’t install the updates, check with your administrator.
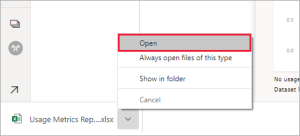
- In the browser dialog asking what you want to do with the Usage Metrics report.odc file, select Open.
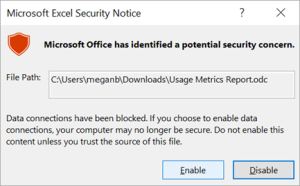
- Power BI launches Excel. Verify the file name and path for the .odc file, then select Enable.
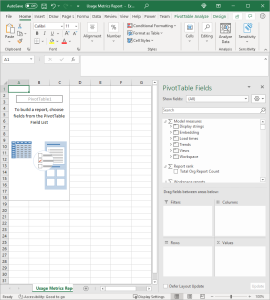
- Now that Excel has opened and you have an empty PivotTable, you can drag fields onto the Rows, Columns, Filters, and Values boxes and create custom views into your usage data.
Which metrics are reported:
| Metric | Dashboard | Report | Description |
| Platforms slicer | yes | yes | Was the dashboard or report accessed via the Power BI service (powerbi.com) or a mobile device? Mobile includes all our iOS, Android, and Windows apps. |
| Report page slicer | no | yes | If the report has more than 1 page, slice the report by the page(s) that was viewed. “Blank” means a report page was recently added (within 24 hours the actual name of the new page appears in the slicer list) or report pages have been deleted. “Blank” captures these types of situations. |
| Views per day | yes | yes | Total number of views per day – a view is defined as a user loading a report page or dashboard. |
| Unique viewers per day | yes | yes | Number of different users who viewed the dashboard or report (based on the Microsoft Entra user account). |
| Views per user | yes | yes | Number of views in the past 90 days, broken down by individual users. |
| Shares per day | yes | no | Number of times the dashboard was shared with another user or group. |
| Total views | yes | yes | Number of views in the past 90 days. |
| Total viewers | yes | yes | Number of unique viewers in the past 90 days. |
| Total shares | yes | no | Number of times the dashboard or report was shared in the past 90 days. |
| Total in organization | yes | yes | Count of all dashboards or reports in the entire organization that had at least one view in the past 90 days. Used to calculate rank. |
| Rank: Total views | yes | yes | For total views of all dashboards or reports in the organization over the past 90 days, where does this dashboard or report rank. |
| Rank: Total shares | yes | no | For total shares of all dashboards in the organization over the past 90 days, where does this dashboard or report rank. |
CONCLUSION:
Usage metrics in Power BI are invaluable tools for monitoring report and dashboard performance, adoption, and user engagement. They provide actionable insights into how end users interact with reports, which pages or visuals are most accessed, and the overall effectiveness of the published content. By analyzing these metrics, organizations can:
- Improve Report Design: Identify underperforming visuals or pages and optimize them to meet user needs.
- Boost Adoption: Understand user preferences and promote reports that add the most value.
- Ensure Governance: Monitor usage to ensure compliance with organizational policies.
- Plan Capacity: Use engagement trends to predict and plan for resource scaling.
- Enhance User Experience: Tailor content delivery by analyzing access patterns and device usage.
Power BI usage metrics, when utilized strategically, can drive data-driven decisions not only for report optimization but also for improving overall business intelligence strategy.