Introduction/ Issue:
The *TIMING# substitution variable represents the elapsed time (in seconds) taken to render a region, including the time to fetch data and render region items. This variable is available for use in the footer of any report region (such as Interactive Reports, Classic Reports, or Charts).
Why we need to do / Cause of the issue:
Performance Transparency: Show users how long their reports take to run, helping set expectations for data-heavy queries.
Troubleshooting: Quickly identify slow-running regions on a page, making it easier to pinpoint and tune problematic queries.
User Communication: When users request large or complex datasets, the timing info helps explain longer wait times.
How do we solve:
Edit the Report Region:
In Page Designer, select the report region you want to monitor.
Add #TIMING# along with other substitution strings to the Footer:
Fetched #ROWS_FETCHED# rows of #TOTAL_ROWS# in #TIMING# seconds
Special Built-in Region Substitution Strings
| Substitution String | Description | | — | — | | #ROWS_FETCHED# | Number of rows fetched by the report | | #TOTAL_ROWS# | Total number of rows in the query | | #TIMING# | Time taken to render the region (in seconds) | | #APEX$ROW_NUM# | Row number in Classic Reports |
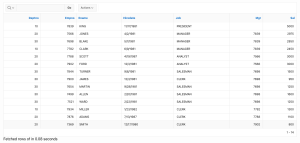
Save and Run:
Save your changes and run the application. The footer will now display real-time execution metrics every time the report runs.
Conclusion:
The *TIMING# substitution variable provides valuable insight into the performance of report regions by displaying the total time taken to fetch and render data. By including this variable in the report footer, developers and users can monitor and evaluate the efficiency of data retrieval and rendering processes, aiding in performance tuning and enhancing the overall user experience.