Introduction
In Oracle APEX Interactive Reports (IR), aggregate values such as SUM or AVG are always displayed at the bottom of the report. For reports with many rows, users must scroll down every time just to see totals, which affects usability and visibility.
There is no built-in option in Oracle APEX to move these aggregates to the top of the report region. As a result, users often miss important summary information during analysis.
This blog explains how to display column totals at the top of an Interactive Report using a pure JavaScript solution, without using plugins or making any backend or SQL changes.
Why We Need This
When working with Interactive Reports:
• Aggregate rows are fixed at the bottom
• Users must scroll to see totals
• Important summary values are easily missed
• Poor user experience in large reports
This issue is common in scenarios where:
• Reports contain many rows
• Totals need quick visibility
• Managers or users focus more on summary data
• Clean and user-friendly UI is required
The impact includes:
• Reduced usability
• Time wasted scrolling
• Missed or overlooked totals
• Less professional report layout
How Do We Solve This
We solve this problem by:
• Reading aggregate values directly from the IR DOM
• Creating a custom top aggregate bar
• Injecting totals above the report toolbar
• Refreshing totals automatically after report refresh
This solution uses:
• JavaScript to fetch and display aggregate values
• No plugins
• No backend or SQL changes.
Steps to Implement:
Step 1: Assign a Static ID to the Interactive Report
Example Static ID:
IRR
Step 2: Add JavaScript Code
Add the following code in Function and Global Variable Declaration:
(function ($) {
var REGION_ID = “IRR”; // IR region Static ID
var COL_IDS = [“A_QTY”,”A_VAL”,”U_QTY”, “U_VAL”,”STOCK_VALUE”]; // column Static IDs
function getHeaderLabel($r, colId) {
var $th = $r.find(“.a-IRR-table th#” + colId + “, .a-IRR-table th[headers='” + colId + “‘], .a-IRR-table th[data-column*='” + colId + “‘]”).first();
if ($th.length) {
if ($th.attr(“abbr”)) return $th.attr(“abbr”).trim();
if ($th.attr(“title”)) return $th.attr(“title”).trim();
var txt = $th.children(“span”).first().text().trim();
if (txt) return txt;
txt = ($th.text() || “”).trim();
if (txt) return txt;
}
return colId;
}
function putTopTotals() {
var $r = $(“#” + REGION_ID);
if (!$r.length) return;
$r.find(“.js-top-agg-bar”).remove(); // clear old
var container = document.createElement(“div”);
container.className = “js-top-agg-bar”;
container.style.cssText = [
“padding:12px”,
“margin:8px 0 10px”,
“border:1px solid #e0e0e0”,
“border-radius:10px”,
“background:#fafafa”
].join(“;”);
// Heading
var heading = document.createElement(“div”);
heading.textContent = “Stock Quantity Value”;
heading.style.cssText = [
“font-weight:700”,
“margin-bottom:8px”,
“font-size:14px”,
“color:#333”
].join(“;”);
container.appendChild(heading);
// Row container for pills
var pillRow = document.createElement(“div”);
pillRow.style.cssText = [
“display:flex”,
“gap:16px”,
“flex-wrap:wrap”,
“align-items:center”
].join(“;”);
container.appendChild(pillRow);
var found = 0;
COL_IDS.forEach(function (colId) {
var $val = $r.find(“.a-IRR-table td.a-IRR-aggregate[headers='” + colId + “‘] .a-IRR-aggregate-value”).last();
if ($val.length) {
found++;
var label = getHeaderLabel($r, colId);
var pill = document.createElement(“div”);
pill.style.cssText = [
“display:inline-flex”,
“align-items:center”,
“gap:8px”,
“padding:6px 12px”,
“border:1px solid #ddd”,
“border-radius:9999px”,
“font-size:13px”,
“background:#fff”
].join(“;”);
var strong = document.createElement(“span”);
strong.style.fontWeight = “600”;
strong.textContent = label + “:”;
var span = document.createElement(“span”);
span.textContent = $val.text().trim();
pill.appendChild(strong);
pill.appendChild(span);
pillRow.appendChild(pill);
}
});
if (found) {
var toolbar = $r.find(“.a-IRR-toolbar”).get(0);
if (toolbar && toolbar.parentNode) {
toolbar.parentNode.insertBefore(container, toolbar);
} else {
var regionBody = $r.find(“.t-Region-body, .a-IRR”).get(0);
if (regionBody) regionBody.insertBefore(container, regionBody.firstChild);
}
}
}
$(document).on(“apexafterrefresh”, “#” + REGION_ID, putTopTotals);
putTopTotals();
})(apex.jQuery);
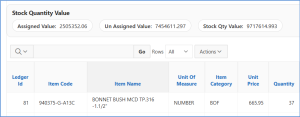
Result:
After applying this solution:
• Aggregate totals appear above the report
• Totals remain visible after filtering or refresh
• Multiple columns can be displayed
• UI becomes cleaner and more professional
Conclusion
Using this lightweight JavaScript approach, we successfully:
• Moved Interactive Report aggregates to the top
• Improved visibility of important totals
• Enhanced user experience
• Avoided plugins and backend changes