
Introduction / Issue
In cloud computing and serverless systems, there may be unexpected bursts of use, causing hidden cost overheads which are untracked. Guardrails are put in place to run every day to parse through API and cloud usage logs and detect any anomaly in costs and generate a PDF report.
However, creating a PDF file is not all that needs to be done. It is imperative to have a web portal for non-tech people and management teams to access those reports, filter them, and download them. The web portal must be able to do this without accessing cloud storage buckets and databases.
Why We Need to Do / Cause of the Issue
The scripts provide useful diagnostic reports, but storing such reports locally on file systems or isolated object storage buckets results in several operational drawbacks:
- Access: Non-technical individuals find it difficult to locate or retrieve the log files or PDF files stored in the backend system.
- Audit Trail and Logging: Without a proper logging system using a database, there is no way to know when the report was created and if there were any issues with its creation.
- User-Friendly Access: Manual downloads of the report via server and database access is a cumbersome process.Through automation that includes creating the PDF using Python, loading the BLOB directly into Oracle Database, and creating a friendly download process via Oracle APEX, a user-friendly dashboard for cloud costs reports is established.
By pairing a real-time FastAPI API Proxy Guardrail with Playwright automated browser monitoring, Oracle Database BLOB storage, and Oracle APEX, we build an automated pipeline that detects cost spikes, logs performance metrics, and securely publishes downloadable PDF reports.
How Do We Solve
This solution is further split into the following three main implementation phases:Python scripting: Execute the cost anomaly detection guardrail and upload the PDF file as Binary Large Objects (BLOBs) to the Oracle Database.
Oracle SQL Developer configuration: Schema creation, privileges on tables/synonyms, and checking objects access (DASHBOARD_PDF_LOGS).
Oracle APEX development: Create the Interactive Report page with the native BLOB download column.
Real-Time Scenario & Step-by-Step Implementation
Step 1: Python Implementation (Proxy, Guardrail, Dashboard & Automation)
Prerequisites & Environment Setup
Install the necessary Python packages and set up your environment variables:
pip install fastapi uvicorn httpx pydantic numpy pandas streamlit plotly playwright oracledb python-dotenv tiktoken openai
playwright install
Step 2: Create a .env file in your root folder:
OPENAI_API_KEY= “YOUR API KEY”
Step 3: Real time cost guardrail Proxy (proxy.py):
The proxy intercepts incoming OpenAI API requests, estimates prompt token counts using tiktoken, evaluates the cost $Z$-score against historical baseline data, blocks anomalous requests (http status 429), and logs clean transactions to a local SQLite database (guardrail.db).
import os
import sqlite3
import time
from datetime import datetime
from collections import defaultdict
import numpy as np
import httpx
import tiktoken
from dotenv import load_dotenv # Added for reading .env
from fastapi import FastAPI, HTTPException, Request, Header
from fastapi.responses import JSONResponse
# Automatically load environment variables from .env file
load_dotenv()
app = FastAPI(title=”Real-Time API Cost Guardrail Gateway”)
# Configuration
WINDOW_SECONDS = 300
ANOMALY_Z_THRESHOLD = 2.0
UPSTREAM_API_URL = “https://api.openai.com/v1/chat/completions”
# Price per 1,000 tokens (GPT-4o-mini rates)
INPUT_COST_PER_1K = 0.00015
OUTPUT_COST_PER_1K = 0.00060
usage_history = defaultdict(list)
def init_db():
conn = sqlite3.connect(“guardrail.db”)
cursor = conn.cursor()
cursor.execute(“””
CREATE TABLE IF NOT EXISTS request_logs (
id INTEGER PRIMARY KEY AUTOINCREMENT,
timestamp DATETIME,
tenant_id TEXT,
estimated_tokens INTEGER,
estimated_cost_usd REAL,
status TEXT,
z_score REAL
)
“””)
conn.commit()
conn.close()
init_db()
def log_request(tenant_id: str, tokens: int, cost: float, status: str, z_score: float):
conn = sqlite3.connect(“guardrail.db”)
cursor = conn.cursor()
cursor.execute(
“INSERT INTO request_logs (timestamp, tenant_id, estimated_tokens, estimated_cost_usd, status, z_score) VALUES (?, ?, ?, ?, ?, ?)”,
(datetime.now(), tenant_id, tokens, cost, status, round(z_score, 2))
)
conn.commit()
conn.close()
def estimate_prompt_tokens(messages: list, model: str = “gpt-4o-mini”) -> int:
“””Accurately calculates token counts using tiktoken tokenizer.”””
try:
encoding = tiktoken.encoding_for_model(model)
except KeyError:
encoding = tiktoken.get_encoding(“cl100k_base”)
total_tokens = 0
for msg in messages:
total_tokens += len(encoding.encode(msg.get(“content”, “”)))
return total_tokens
def evaluate_cost_anomaly(tenant_id: str, estimated_cost: float):
now = time.time()
usage_history[tenant_id] = [
(ts, c) for ts, c in usage_history[tenant_id] if now – ts <= WINDOW_SECONDS
]
recent_costs = [c for _, c in usage_history[tenant_id]]
usage_history[tenant_id].append((now, estimated_cost))
if len(recent_costs) < 5:
return False, 0.0
mean_cost = np.mean(recent_costs)
std_cost = np.std(recent_costs)
if std_cost == 0:
is_anomaly = estimated_cost > (mean_cost * 2.5)
return is_anomaly, 3.0 if is_anomaly else 0.0
z_score = (estimated_cost – mean_cost) / std_cost
return z_score > ANOMALY_Z_THRESHOLD, float(z_score)
@app.post(“/v1/chat/completions”)
async def proxy_live_request(request: Request, x_tenant_id: str = Header(default=”production_client”)):
“””
Real-Time Proxy: Intercepts real payloads, evaluates costs, forwards to OpenAI,
and returns live responses back to caller.
“””
body = await request.json()
messages = body.get(“messages”, [])
model = body.get(“model”, “gpt-4o-mini”)
# 1. Estimate incoming prompt tokens & cost
prompt_tokens = estimate_prompt_tokens(messages, model)
est_prompt_cost = (prompt_tokens / 1000) * INPUT_COST_PER_1K
# 2. Pre-execution Cost Anomaly Guardrail
is_anomaly, z_score = evaluate_cost_anomaly(x_tenant_id, est_prompt_cost)
if is_anomaly:
log_request(x_tenant_id, prompt_tokens, est_prompt_cost, “BLOCKED_ANOMALY”, z_score)
raise HTTPException(
status_code=429,
detail={
“error”: “Cost Anomaly Guardrail Triggered”,
“tenant_id”: x_tenant_id,
“cost_usd”: round(est_prompt_cost, 5),
“z_score”: round(z_score, 2),
“message”: “Real-time request blocked due to sudden token usage spike.”
}
)
# 3. Request cleared guardrail: Forward request to Upstream Provider
api_key = os.getenv(“OPENAI_API_KEY”)
headers = {
“Authorization”: f”Bearer {api_key}”,
“Content-Type”: “application/json”
}
async with httpx.AsyncClient() as client:
try:
upstream_response = await client.post(
UPSTREAM_API_URL,
json=body,
headers=headers,
timeout=30.0
)
except httpx.RequestError as exc:
raise HTTPException(status_code=502, detail=f”Upstream provider connection error: {exc}”)
response_data = upstream_response.json()
# 4. Extract actual post-call billing data returned from live provider
if upstream_response.status_code == 200 and “usage” in response_data:
actual_total_tokens = response_data[“usage”].get(“total_tokens”, prompt_tokens)
prompt_t = response_data[“usage”].get(“prompt_tokens”, 0)
completion_t = response_data[“usage”].get(“completion_tokens”, 0)
actual_cost = ((prompt_t / 1000) * INPUT_COST_PER_1K) + ((completion_t / 1000) * OUTPUT_COST_PER_1K)
log_request(x_tenant_id, actual_total_tokens, actual_cost, “PASSED”, z_score)
else:
log_request(x_tenant_id, prompt_tokens, est_prompt_cost, “FAILED_UPSTREAM”, z_score)
return JSONResponse(status_code=upstream_response.status_code, content=response_data)
if __name__ == “__main__”:
import uvicorn
uvicorn.run(“proxy:app”, host=”127.0.0.1″, port=8000, reload=True)
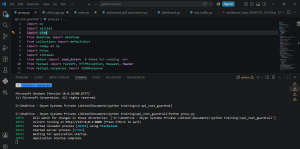
Step 3: Start the Proxy server:
Command : Python proxy.py
Step 4: Client Application Test Script
import os
from dotenv import load_dotenv
from openai import OpenAI
# Load API key from .env file
load_dotenv()
# Initialize the OpenAI client pointing to YOUR PROXY instead of OpenAI
client = OpenAI(
base_url=”http://127.0.0.1:8000/v1″, # Routes through proxy.py
api_key=os.getenv(“OPENAI_API_KEY”, “dummy_key_if_handled_by_proxy”)
)
def make_real_request():
print(“Sending real prompt through proxy…”)
try:
response = client.chat.completions.create(
model=”gpt-4o-mini”,
messages=[
{“role”: “system”, “content”: “You are a helpful technical assistant.”},
{“role”: “user”, “content”: “Explain vector databases in two concise sentences.”}
],
# Custom header to track which team/user sent the request
extra_headers={“X-Tenant-ID”: “finance_team”}
)
print(“\n— Response Received —“)
print(response.choices[0].message.content)
except Exception as e:
print(f”\n Request Error / Blocked by Guardrail: {e}”)
if __name__ == “__main__”:
make_real_request()
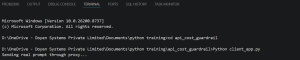
Step 5: To test request flow:
Command : Python client_app.py
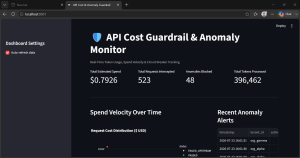
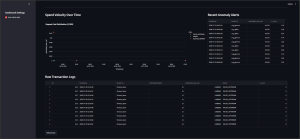
Step 6: Real -Time Visual Analytics Dashboard with playwright PDF snapsjot engine
Launch the streamlit visualization interface to track spend velocity, request Anomalies and transaction distributions in real time.
Command : streamlit run dashboard.py
import sqlite3
import pandas as pd
import plotly.express as px
import streamlit as st
# Page configuration
st.set_page_config(page_title=”API Cost & Anomaly Guardrail”, layout=”wide”)
st.title(“🛡️ API Cost Guardrail & Anomaly Monitor”)
st.caption(“Real-Time Token Usage, Spend Velocity & Circuit Breaker Tracking”)
def load_data():
conn = sqlite3.connect(“guardrail.db”)
cursor = conn.cursor()
# Ensure table exists before querying to avoid missing table errors
cursor.execute(“””
CREATE TABLE IF NOT EXISTS request_logs (
id INTEGER PRIMARY KEY AUTOINCREMENT,
timestamp DATETIME,
tenant_id TEXT,
estimated_tokens INTEGER,
estimated_cost_usd REAL,
status TEXT,
z_score REAL
)
“””)
conn.commit()
# Read data into DataFrame
df = pd.read_sql_query(“SELECT * FROM request_logs ORDER BY timestamp DESC”, conn)
conn.close()
if not df.empty:
df[“timestamp”] = pd.to_datetime(df[“timestamp”])
return df
# Sidebar settings
st.sidebar.header(“Dashboard Settings”)
auto_refresh = st.sidebar.checkbox(“Auto-refresh data”, value=False)
if auto_refresh:
# Refresh every 3 seconds
st.empty()
time_delay = 3
df = load_data()
# Top Banner Metrics
col1, col2, col3, col4 = st.columns(4)
if not df.empty:
total_spend = df[“estimated_cost_usd”].sum()
total_requests = len(df)
blocked_requests = len(df[df[“status”] == “BLOCKED_ANOMALY”])
total_tokens = df[“estimated_tokens”].sum()
col1.metric(“Total Estimated Spend”, f”${total_spend:.4f}”)
col2.metric(“Total Requests Intercepted”, f”{total_requests:,}”)
col3.metric(
“Anomalies Blocked”, f”{blocked_requests:,}”, delta_color=”inverse”
)
col4.metric(“Total Tokens Processed”, f”{total_tokens:,}”)
st.markdown(“—“)
# Layout: Chart + Blocked Logs
left_col, right_col = st.columns([2, 1])
with left_col:
st.subheader(“Spend Velocity Over Time”)
fig = px.strip(
df,
x=”timestamp”,
y=”estimated_cost_usd”,
color=”status”,
hover_data=[“tenant_id”, “estimated_tokens”, “z_score”],
color_discrete_map={
“PASSED”: “#2ECC71”,
“BLOCKED_ANOMALY”: “#E74C3C”,
},
title=”Request Cost Distribution ($ USD)”,
)
st.plotly_chart(fig, use_container_width=True)
with right_col:
st.subheader(“Recent Anomaly Alerts”)
blocked_df = df[df[“status”] == “BLOCKED_ANOMALY”][
[“timestamp”, “tenant_id”, “estimated_cost_usd”, “z_score”]
].head(10)
if not blocked_df.empty:
st.dataframe(blocked_df, hide_index=True, use_container_width=True)
else:
st.success(“No anomalies detected recently.”)
st.subheader(“Raw Transaction Logs”)
st.dataframe(df.head(20), use_container_width=True)
else:
st.info(
“Database connected successfully! No request logs recorded yet. Start `proxy.py` and run `test_traffic.py` to stream live traffic into the dashboard.”
)
# Manual Refresh Button
if st.button(“Refresh Data”):
st.rerun()
Step 7: PDF snapshot engine
Command : Python dashboard_pdf_automation.py
import asyncio
import time
import oracledb
from playwright.async_api import async_playwright
# ——————————————————————-
# 1. Oracle Database Connection Configuration
# ——————————————————————-
DB_USER = “username”
DB_PASSWORD = “password”
DB_DSN = “DSN details”
def save_pdf_to_oracle(pdf_bytes, filename):
“””Inserts the binary PDF data (BLOB) into Oracle Database.”””
try:
connection = oracledb.connect(
user=DB_USER,
password=DB_PASSWORD,
dsn=DB_DSN
)
cursor = connection.cursor()
sql = “””
INSERT INTO DASHBOARD_PDF_LOGS (DASHBOARD_NAME, PDF_CONTENT, FILE_NAME)
VALUES (:1, :2, :3)
“””
cursor.execute(sql, [“LLM Anomaly Dashboard”, pdf_bytes, filename])
connection.commit()
print(f” Successfully saved {filename} to Oracle DB!”)
except Exception as e:
print(f”❌ Database error: {e}”)
finally:
if ‘cursor’ in locals():
cursor.close()
if ‘connection’ in locals():
connection.close()
# ——————————————————————-
# 2. Browser Automation & PDF Generation
# ——————————————————————-
async def monitor_and_capture_dashboard(dashboard_url: str, poll_interval: int = 10):
“””
Monitors the dashboard. Captures PDF on initial load and whenever
it detects a page refresh/navigation event.
“””
async with async_playwright() as p:
browser = await p.chromium.launch(headless=True)
context = await browser.new_context()
page = await context.new_page()
async def capture_pdf():
“””Helper function to render PDF and save to DB.”””
timestamp = time.strftime(“%Y%m%d_%H%M%S”)
filename = f”dashboard_snap_{timestamp}.pdf”
print(f”📸 Generating PDF snapshot: {filename}…”)
# Generate PDF in memory (bytes)
pdf_bytes = await page.pdf(
format=”A4″,
print_background=True,
margin={“top”: “20px”, “right”: “20px”, “bottom”: “20px”, “left”: “20px”}
)
# Optional: Save locally in VS Code workspace
with open(filename, “wb”) as f:
f.write(pdf_bytes)
# Push directly to Oracle DB
save_pdf_to_oracle(pdf_bytes, filename)
# Event listener: Triggers capture automatically whenever the page reloads/refreshes
async def on_framenavigated(frame):
if frame == page.main_frame:
print(“\n🔄 Page refresh/navigation detected!”)
# Wait briefly for charts/CSS to fully render post-refresh
await asyncio.sleep(2)
await capture_pdf()
# Attach page reload listener
page.on(“framenavigated”, on_framenavigated)
print(f”🚀 Navigating to dashboard: {dashboard_url}”)
await page.goto(dashboard_url, wait_until=”networkidle”)
print(“👀 Monitoring page refreshes. Press Ctrl+C in VS Code terminal to stop.”)
# Keep the script running in an event loop
try:
while True:
await asyncio.sleep(1)
except KeyboardInterrupt:
print(“Stopping monitor…”)
finally:
await browser.close()
# ——————————————————————-
# 3. Execution Entry Point
# ——————————————————————-
if __name__ == “__main__”:
# Replace with your local or hosted dashboard URL
DASHBOARD_URL = “http://localhost:8501” # e.g., Streamlit, React, or local web app
asyncio.run(monitor_and_capture_dashboard(DASHBOARD_URL))
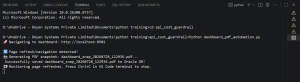
Step 8: SQL developer Database Connection
CREATE TABLE DASHBOARD_PDF_LOGS (
PDF_ID NUMBER GENERATED BY DEFAULT AS IDENTITY PRIMARY KEY,
CREATED_AT TIMESTAMP DEFAULT CURRENT_TIMESTAMP,
DASHBOARD_NAME VARCHAR2(200),
PDF_CONTENT BLOB,
FILE_NAME VARCHAR2(250)
);
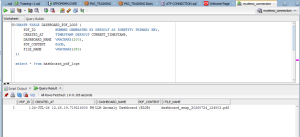
Note: Connect to the same database connection in the pdf generation engine.
Now comes the APEX Integration!!
Step 1: Create an Oracle APEX Application
- Log in to your Oracle APEX workspace (for example, apex.oracle.com).
- Navigate to App Builder.
- Click Create.
- Select New Application.
- Enter Dashboard PDF Manageras the application name.
- Click Create Application.
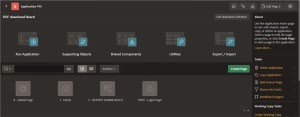
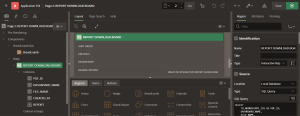
Step 2: Create an Interactive Report Page
- Open your newly created application.
- Click Create Page.
- Select Interactive Report.
- Enter PDF Downloadsas the Page Name.
- Set Source Typeto SQL Query.
- Enter the following SQL query:
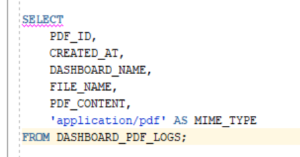
Step 3: Configure the BLOB Download Column
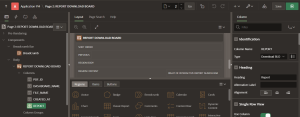
- Open the Page Designerfor the Interactive Report page.
- In the Renderingtree, expand Regions.
- Expand the PDF Downloads
- Expand Columns.
- Select the PDF_CONTENT
- In the Property Editor, set Typeto Download BLOB.
- Set the Headingto Download PDF.
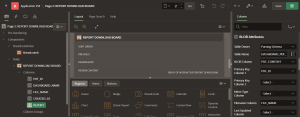
- Scroll down to the BLOB Attributes
- Set Table Nameto DASHBOARD_PDF_LOGS.
- Set BLOB Columnto PDF_CONTENT.
- Set Primary Key Column 1to PDF_ID.
Step 4: Save and Run the Application
- Click the Save
- Click RunPage.
- The Interactive Report will display all records from the DASHBOARD_PDF_LOGS
- Locate the required PDF record.
- Click the Download
- Oracle APEX will download the selected PDF stored in the database to your local machine.

Conclusion
With the combination of FastAPI proxy guardrails, Playwright automation, Oracle Database BLOB storage, and Oracle APEX, we have created a full-fledged LLM cost monitoring system:
Proactive Budget Safeguarding: On-the-fly $Z$-score calculations prevent abnormal usage peaks before incurring any cost via API calls.
Automated Logging: The Playwright logs Streamlit dashboard renders in Oracle Database without requiring any manual effort.
Enterprise Accessibility: The non-technical users can easily review and download PDF reports from Oracle APEX interface.
